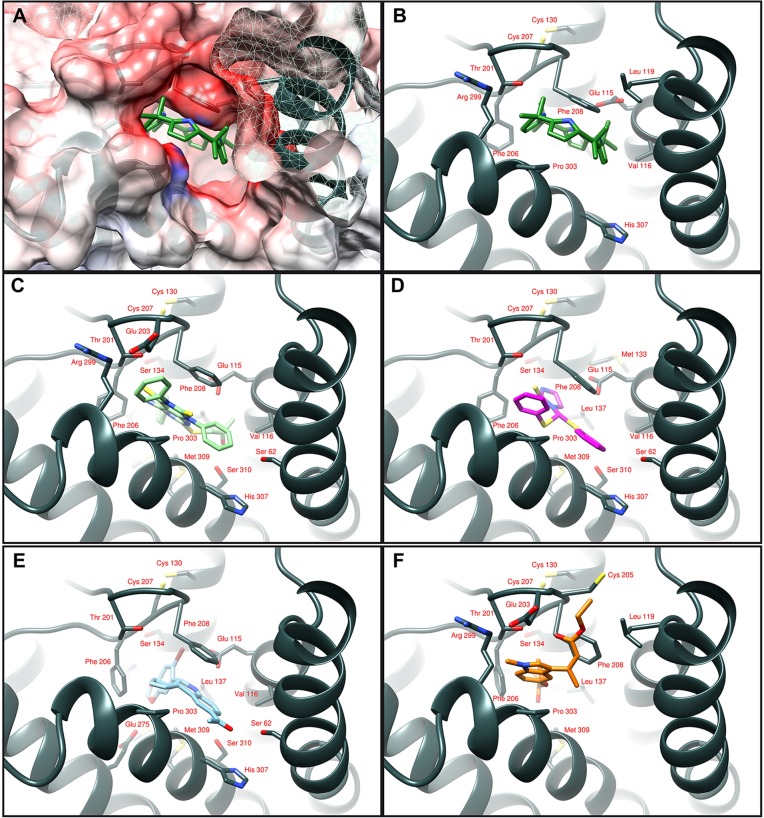
Fig. 2. Ligand binding modes to GPER. (A) C4PY in the protein binding cleft is drawn in green. The protein surface is colored according to its electrostatic potential (blue positive, red negative). The same ligand binding mode is schematically reported in panel B, where the interacting amino acids are indicated as dark gray sticks. (C,D) The agonists GPER-L1 and GPER-L2 are drawn in light green (C) and purple (D) sticks, respectively. Binding mode of G-1 (cyan) is shown in panel E and the full-antagonist MIBE (orange) in panel F.
Image published in: Lappano R et al. (2015)
© 2015. Creative Commons Attribution license
Permanent Image Page
Printer Friendly View
XB-IMG-169298