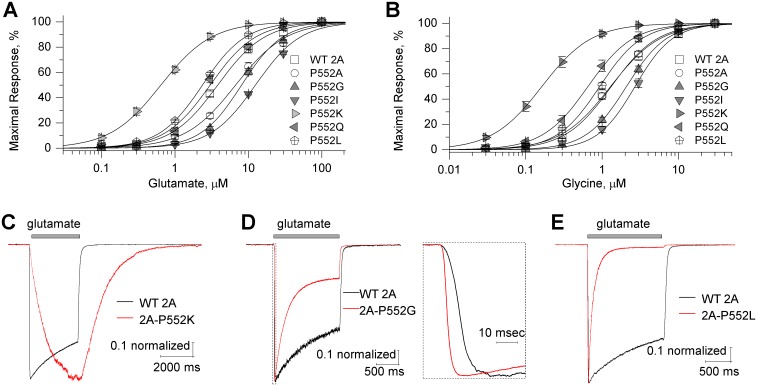
Fig 6. Assessment of alternative Pro552 substitutions in GluN2A.A,B, the composite glutamate (in the presence of 100 μM glycine) and glycine (in the presence of 100 μM glutamate) concentration-response curves of GluN2A- P552A, P552G, P552I, P552K, P552Q, P552L constructs. Error bars are SEM and shown when larger than symbol. C,D,E, The response time courses are shown of GluN1/GluN2A(P552K), GluN1/GluN2A(P552G), and GluN1/GluN2A(P552L) receptors activated by rapid application of 100 μM glutamate; 100 μM glycine was present in all solutions. For panel D the rise time is expanded as an inset. The data (mean ± SEM) are given in Table 7.
Image published in: Ogden KK et al. (2017)
© 2017 Ogden et al. Creative Commons Attribution license
Permanent Image Page
Printer Friendly View
XB-IMG-170107