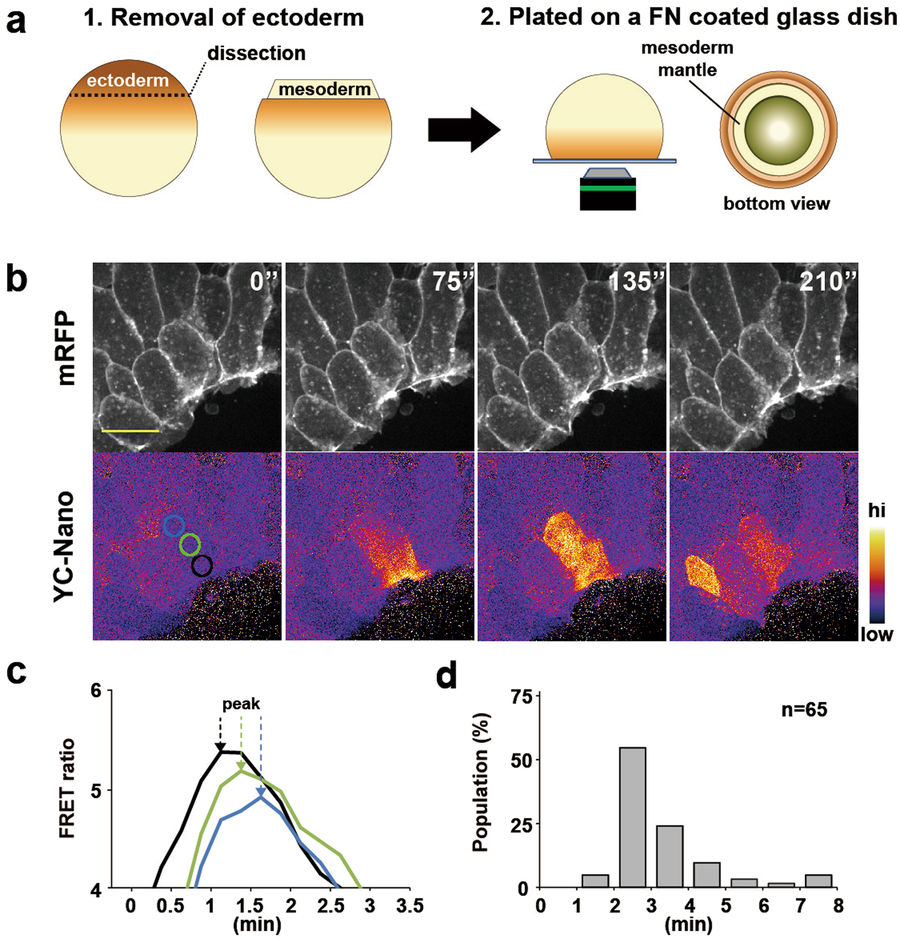
Figure 1. Ca2+ dynamics in a single cell. (a) Experimental design using cap-less explants. (1) The animal cap was removed at st12â12.5. (2) The cap-less explant was placed with the animal pole side down on a fibronectin-coated glass dish, and viewed from the bottom. (b) Snapshots from time-lapse calcium imaging of single cells. Upper panel: mRFP. Lower panel: FRET ratio of yellow cameleon-nano. The FRET ratio was converted to pseudocolours (bar at right). Scale bar: 50âμm. (c) Plot of the FRET ratio intensity over time for each of the areas shown in coloured circles in (b). Arrows indicate the points of maximum values. (d) Histogram of the calcium transient duration. nâ=â65 calcium transients.
Image published in: Hayashi K et al. (2018)
© The Author(s) 2018. Creative Commons Attribution license
Permanent Image Page
Printer Friendly View
XB-IMG-171501