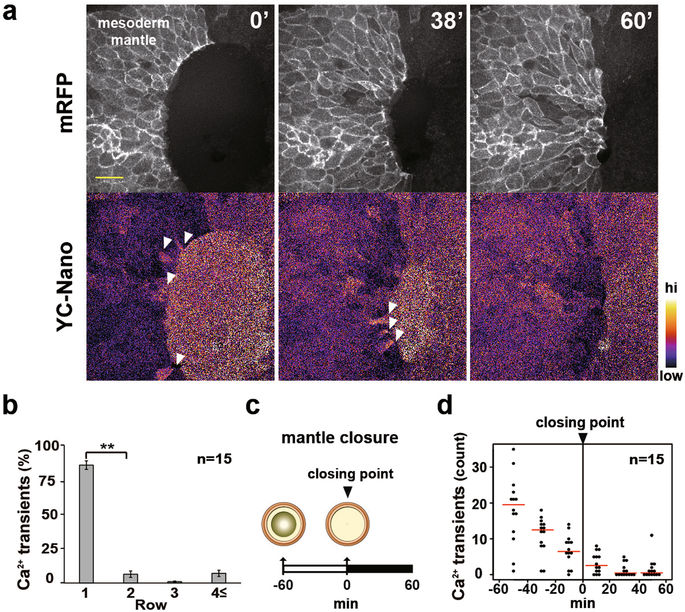
Figure 2. Ca2+ transients and their localization in LEM cells. (a) Snapshots of time-lapse imaging of the Ca2+ dynamics in the migrating LEM. FRET ratio images of yellow cameleon-nano were converted to pseudocolours (bar at right). White arrowheads indicate calcium transients. (b) Location of Ca2+ transients during mantle closing. n = 15 embryos. Error bars indicate s.e. ± Student’s t-test, **P < 0.005. (c) Illustration of the time course of mantle closure. (d) Frequency of Ca2+ transients during mantle closure. Red bars indicate average values. n = 15 embryos.
Image published in: Hayashi K et al. (2018)
© The Author(s) 2018. Creative Commons Attribution license
Permanent Image Page
Printer Friendly View
XB-IMG-171502