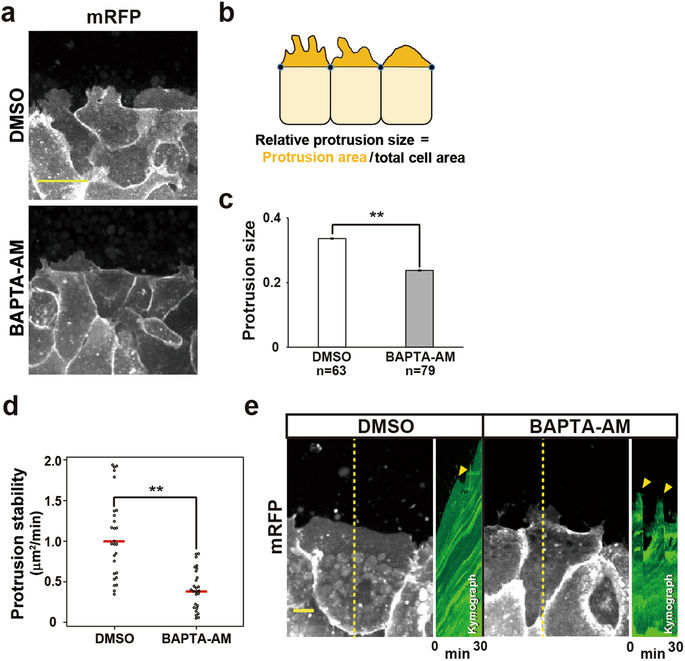
Figure 6. Suppression of Ca2+ transients reduce the protrusive activity in LEM cells. (a) Snapshots of BAPTA-AM- and DMSO-treated DMZ explants. Scale bar: 50âμm. (b) Procedure for measuring the protrusion activity in LEM cells. (c) Protrusion size in DMSO- and BAPTA-AM-treated LEM cells. DMSO: nâ=â63 cells from 14 embryos, BAPTA-AM: nâ=â79 cells from 13 embryos. Error bars indicate s.e. ± MannâWhitney U-test, **Pâ<â0.005. (d) Protrusion stability in DMSO- and BAPTA-AM-treated LEM cells. DMSO: nâ=â27 cells from 9 embryos, BAPTA-AM: nâ=â27 cells from 9 embryos. Red bars indicate average value. Studentâs t-test, **Pâ<â0.005. (e) Protrusion dynamics in DMSO and BAPTA-AM-treated LEM cells. Left figure with yellow dotted line is entire view of leader cell. Right figure is kymograph along to dotted yellow line. Yellow arrowheads indicate retraction of cellular protrusion. Scale bar: 25âμm.
Image published in: Hayashi K et al. (2018)
© The Author(s) 2018. Creative Commons Attribution license
Permanent Image Page
Printer Friendly View
XB-IMG-171506