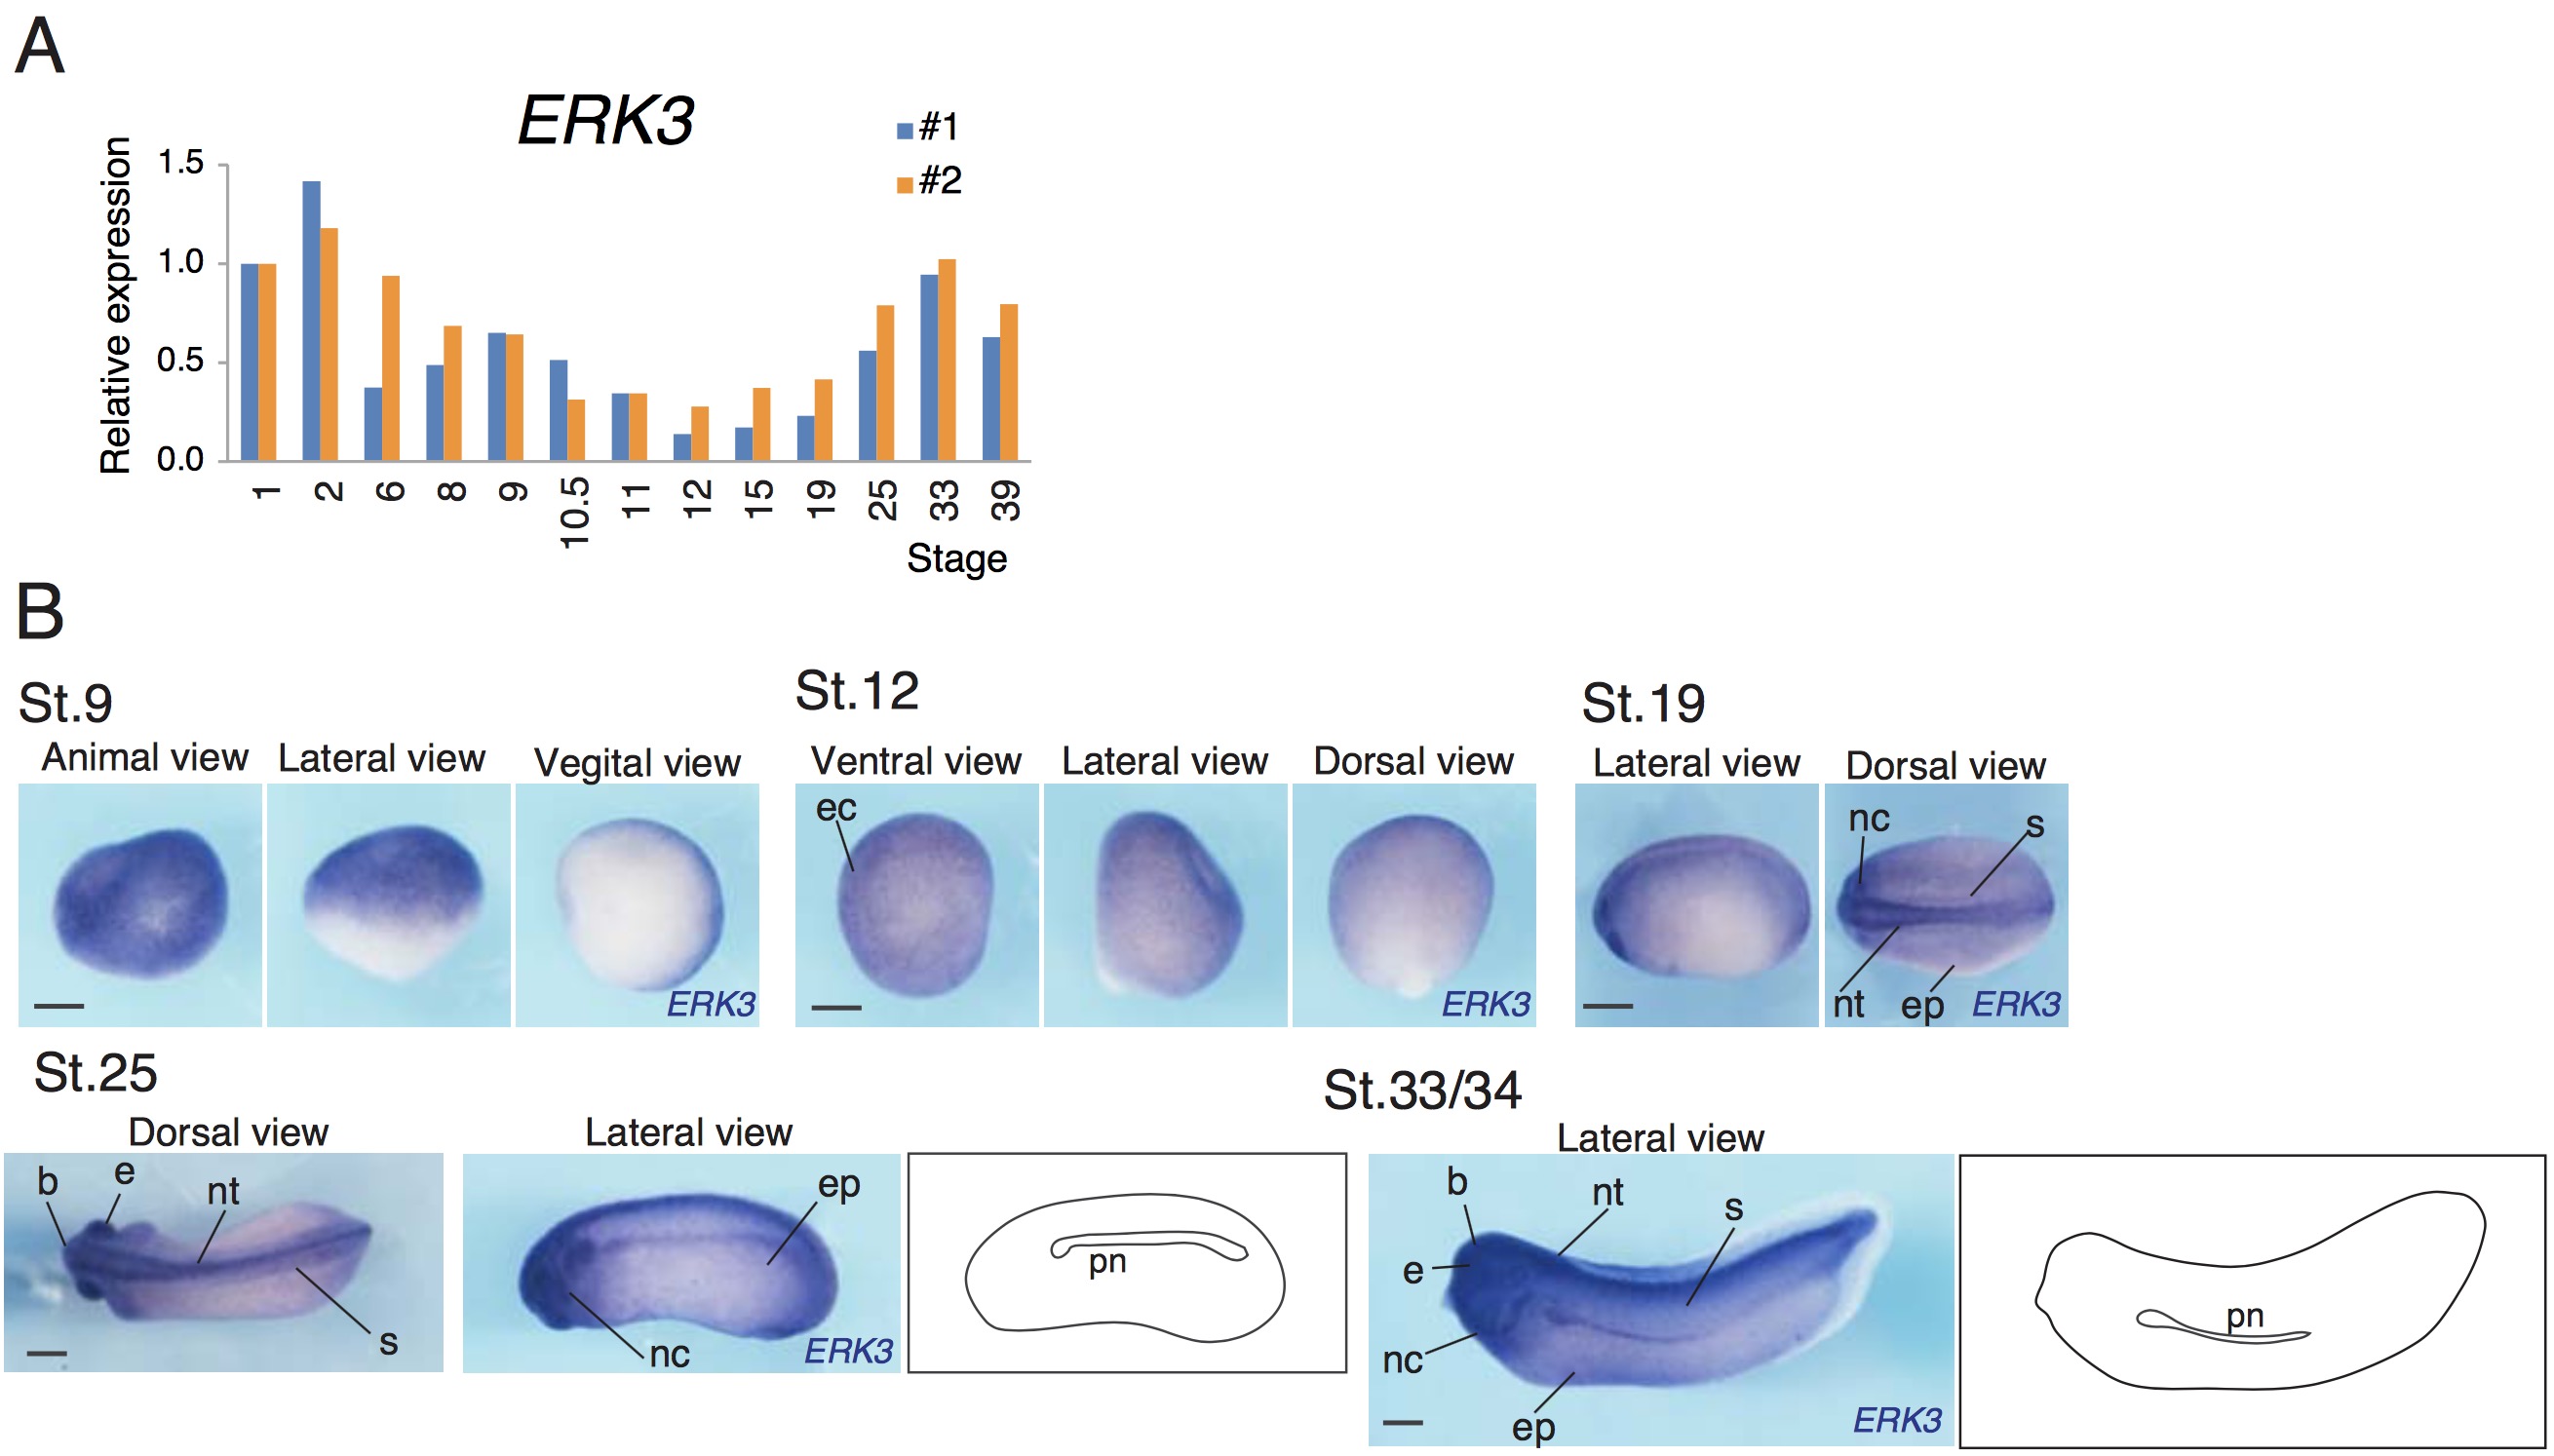
Figure 1. ERK3 expression in Xenopus laevis embryos. A, Real-time quantitative RT-PCR analysis. The expression levels of ERK3 were normalized to those of odc in two independent experiments (#1 and #2). The normalized ERK3 expression level at stage 1 was defined as 1.0 in each experiment. B, Whole-mount in situ hybridization analysis of ERK3 expression. ec, ectoderm; nc, neural crest; s, somite; nt, neural tube; ep, epidermis; pn, pronephros; b, brain; e, eye. Scale bars, 400 ïm. Anterior is to the left (stage 19-33/34). Dorsal is up for the lateral views (stage 19-33/34). Shown are representative images of 6-10 embryos from one experiment using the ERK3A probe. Essentially the same results were obtained for 6-9 embryos from another experiment using the ERK3B probe.
Image published in: Takahashi C et al. (2018)
Copyright © 2018. Image reproduced with permission of the Publisher and the copyright holder. This is an Open Access article distributed under the terms of the Creative Commons Attribution License.
| Gene | Synonyms | Species | Stage(s) | Tissue |
|---|---|---|---|---|
| mapk6.L | erk3, p97mapk, prkm6 | X. laevis | Throughout NF stage 12 | ectoderm animal cap |
| mapk6.L | erk3, p97mapk, prkm6 | X. laevis | Throughout NF stage 19 | neural tube neural crest somite epidermis |
| mapk6.L | erk3, p97mapk, prkm6 | X. laevis | Sometime during NF stage 25 to NF stage 33 and 34 | brain eye neural tube pronephric kidney pronephric mesenchyme neural crest epidermis somite |
| mapk6.L | erk3, p97mapk, prkm6 | X. laevis | Throughout NF stage 9 | animal hemisphere |
Image source: Published
Permanent Image Page
Printer Friendly View
XB-IMG-172383