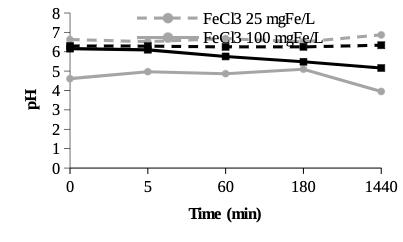
Figure S1. Time course of pH values of treatment solutions containing FeCl3 and FeSO4 at concentrations of 25 and 100mg Fe/L over 24 h. Each point represents the mean ± SEM of three independent assays.
Image published in: Bonfanti P et al. (2020)
Copyright © 2020. The Author(s). OA ARTICLE, images redisplayed under a Creative Commons license.
Permanent Image Page
Printer Friendly View
XB-IMG-178475