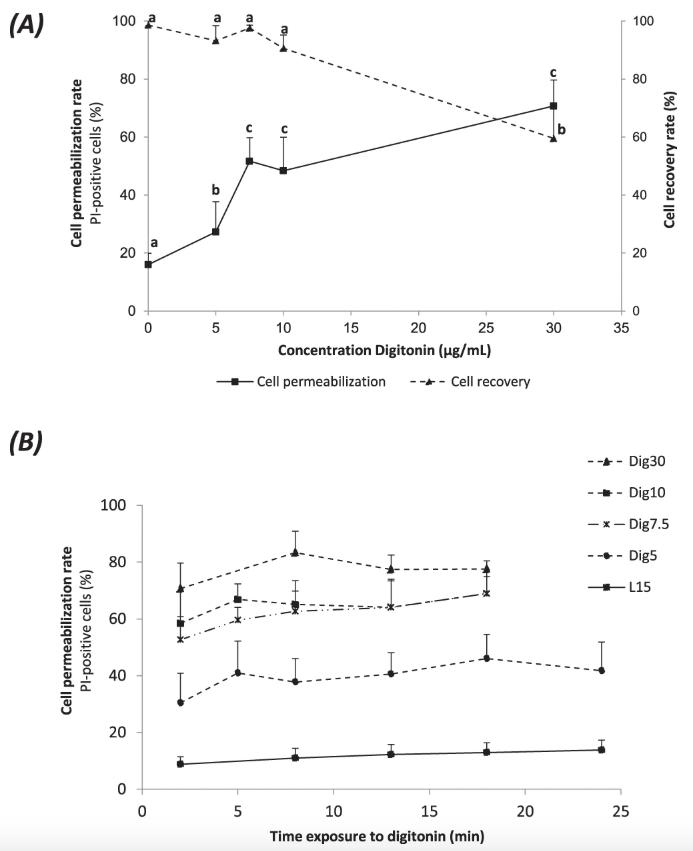
Figure 1: Digitonin-induced permeabilization of fin cells in suspension. Mesenchymal fin cells were tested for their ability to respond to various digitonin treatments. (A) Permeabilization rates and cell recovery rates after 2âmin incubation. (B) Response over time of digitonin-induced permeabilization (2 to 24âmin). Cells were incubated at digitonin concentrations ranging from 5 to 30âµg/mL and labelled with the non membrane permeant propidium iodide (PI). Cell permeabilization rates are expressed as a percentage of PI-positive cells to the total cell number in the sample. Cell recovery rates are expressed as a percentage of the cell number after digitonin treatment to the initial cell number before treatment. Bars represent meansâ±âSD (nâ=â3 to 13 independent fin cell suspension). In (A), different letters indicate significant differences (pâ<â0.01) for a given concentration.
Image published in: Chênais N et al. (2019)
© The Author(s) 2019. Creative Commons Attribution license
Permanent Image Page
Printer Friendly View
XB-IMG-181396