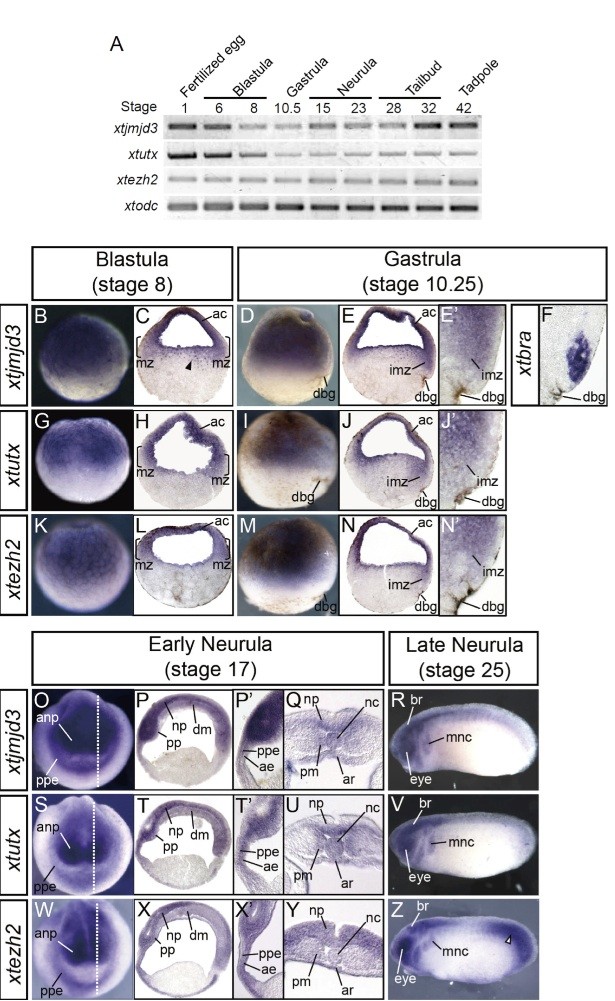
Fig. 3. Developmental expression of xtjmjd3, xtutx and xtezh2. (A)Temporal expression was analyzed in whole embryos by RT-PCR at indicated stages. xtodc was used as a loading control (Sindelka et al., 2006). (B-Z) In situ hybridization analysis of blastula, gastrula and neurula embryos. (B,C,G,H,K,L) Expression at the blastula stage. Lateral views of the whole embryos (B,G,K), and their sections are shown (C,H,L). The animal pole is at the top. A black triangle in C indicates dotted expression of xtjmjd3intheupperpartofthevegetalregion.(D-EI-JM-N Expression at the gastrula stage. Lateral views of the whole embryos (D,I,M), sections (E,J,N), and high magnification views of the sections focusing on the involuting marginal zone (EJN are shown. The animal pole is at the top, and dorsal is to the right.The expression of the X. tropicalis brachyury gene (xtbra) was also examined for comparison with xtjmjd3 (F), since Jmjd3 is involved in the regulation of brachyury in mouse ES cells (see Discussion). (O-Q,S-U,W-Y) Expression at the early neurula stage. (O,S,W) Frontal views. White broken lines indicate the planes of the parasagittal sections shown in P, T and X. (PTX High magnification views of the parasaggital sections in the anterior region. (Q,U,Y) Transverse sections of the dorsal part of the embryos. (R,V,Z) Expression at the late neurula stage. Lateral views of whole embryos are shown. A white triangle indicates posterior expression of xtezh2. ac, animal cap; mz, marginal zone; dbg, dorsal blastoporal groove; anp, anterior neural plate; ppe, preplacodal ectoderm; np, neural plate; pp, precaudal plate; dm, dorsal mesoderm; ae, anterior endoderm; nc, notochord; pm, paraxial mesoderm; ar, archenteron roof; br, brain; mnc, migrating neural crest.
Image published in: Kawaguchi A et al. (2012)
Copyright © 2012. Image reproduced with permission of the Publisher, University of the Basque Country Press.
Permanent Image Page
Printer Friendly View
XB-IMG-77251