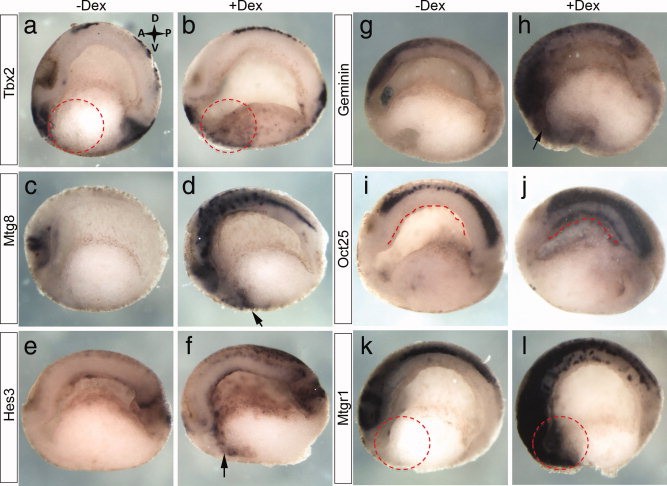
Figure 8. Validation of microarray data. Following 4 h of Ngn3-GR activation at Stage 12 candidate genes from the microarray analysis were increased in the endoderm at Stage 15: (a,b) tbx2 (n = 24/24). (c,d) mtg8 (n = 21/21). (e,f) hes3 (n = 14/42). (g,h) geminin (n = 13/44). (i,j) oct25 (n = 13/13). And at Stage 20: (k,l) mtgr1 (n = 9/13). Dashed circles and arrows indicate ectopic expression in the anterior endoderm. Dashed line indicates ectopic expression in the dorsal endoderm.
Image published in: Oropeza D and Horb M (2012)
Copyright © 2012. Image reproduced with permission of the Publisher, John Wiley & Sons.
| Gene | Synonyms | Species | Stage(s) | Tissue |
|---|---|---|---|---|
| tbx2.L | ET, tbx2-a, tbx2-b, Xltbx2, xtbx2 | X. laevis | Throughout NF stage 15 | involuted ventral mesoderm cement gland primordium preplacodal ectoderm |
| runx1t1.L | LOC108695382 | X. laevis | Throughout NF stage 15 | foregut endoderm pre-chordal neural plate presumptive midbrain-hindbrain boundary prechordal plate |
| hes5.10.L | esr-6e, esr6e | X. laevis | Throughout NF stage 15 | foregut endoderm circumblastoporal collar involuted dorsal mesoderm involuted ventral mesoderm suprablastoporal endoderm archenteron gastrocoel roof plate |
| gmnn.S | gem, geminin | X. laevis | Throughout NF stage 15 | neural plate pre-chordal neural plate chordal neural plate |
| pou5f3.2.L | Oct-25, oct25, pou25, xoct-25, xoct25 | X. laevis | Throughout NF stage 15 | chordal neural plate |
| cbfa2t2.L | MTGR1, XETOR | X. laevis | Throughout NF stage 15 | liver diverticulum chordal neural plate neural plate pre-chordal neural plate |
Image source: Published
Permanent Image Page
Printer Friendly View
XB-IMG-81674