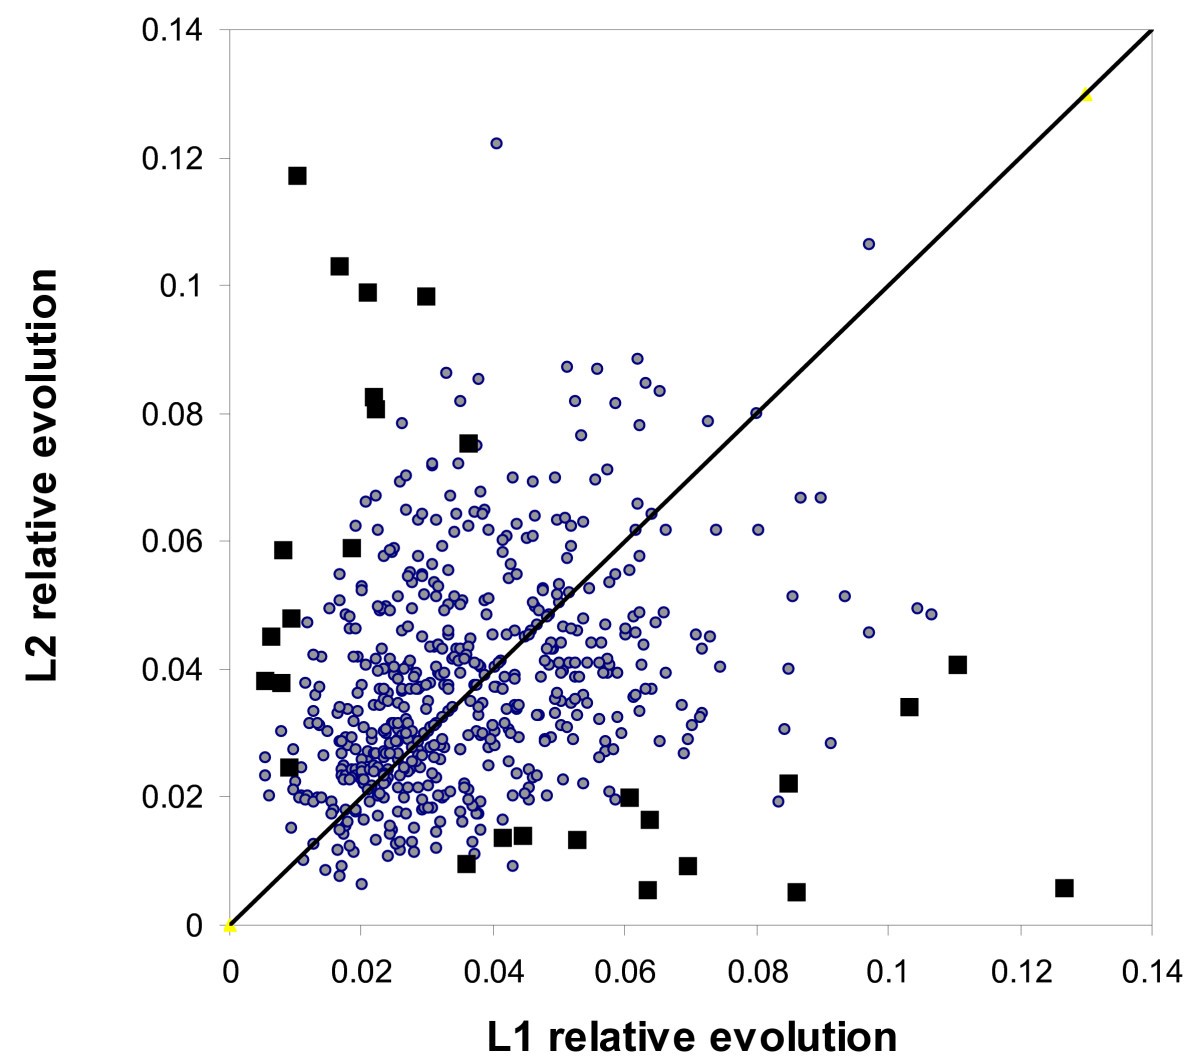
Figure 2. Symmetric evolution of paralogs. Scatter plot of relative evolution between X. tropicalis peptides and their co-orthologous sequences in X. laevis. A total of 578 gene triples with 16 or more highly-conserved positions are shown (see text for details). L1 and L2 refer to co-orthologous genes 1 and 2 in X. laevis. The diagonal line represents a null model assuming symmetric evolution of L1 and L2. Black boxes are L1�L2 pairs inconsistent with this model at P < 0.01.
Image published in: Hellsten U et al. (2007)
Copyright © 2007 Hellsten et al; licensee BioMed Central Ltd. Creative Commons Attribution license
Permanent Image Page
Printer Friendly View
XB-IMG-83447