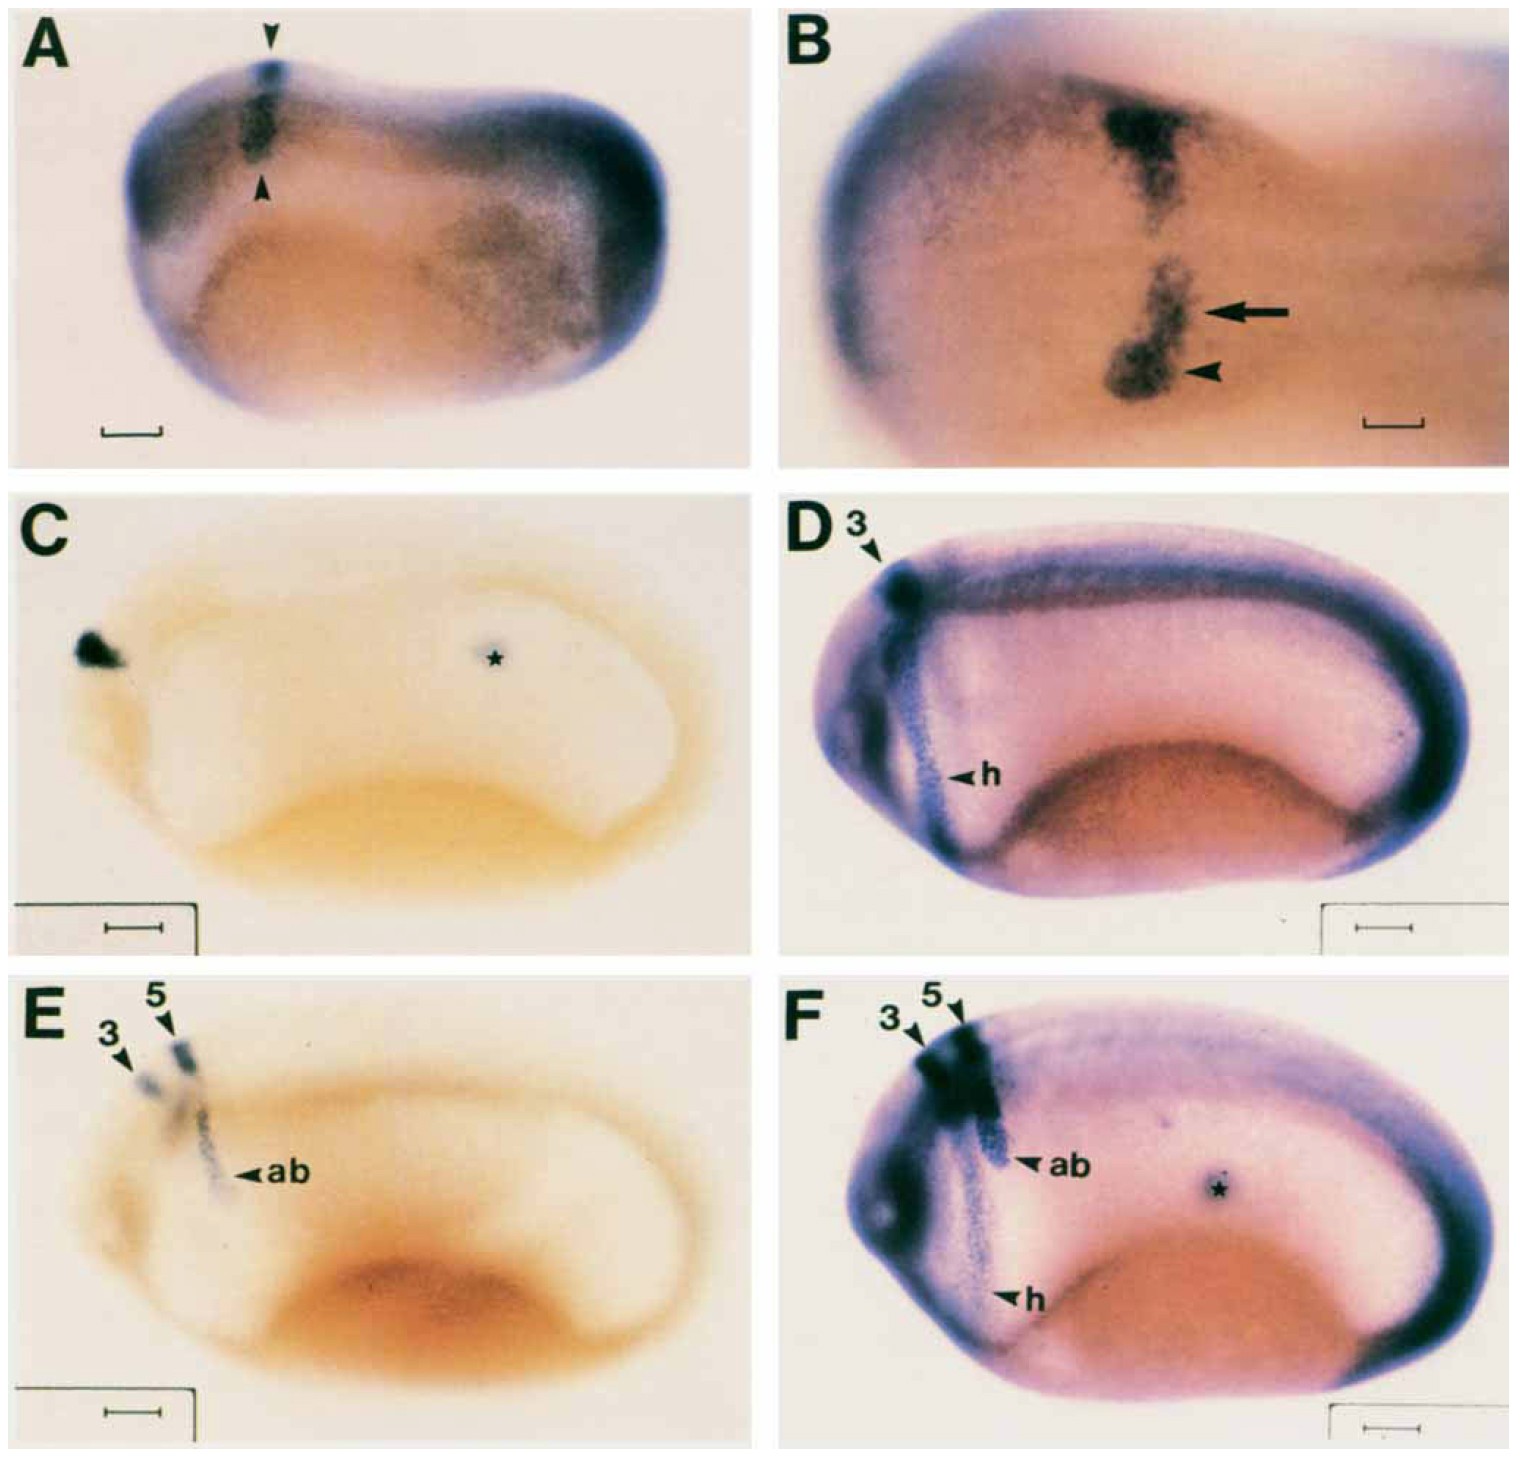
Fig. 8. Whole-mount in situ hybridization analysis of G50 expression in neurula and early tailbud stage Xenopus embryos. A: Lateral view of a stage 17 embryo stained for G50 mRNA expression. Transcripts are detected in two bilateral stripes of cells in the head region (arrowheads), and diffusely in the posterior end of the embryo. 6: Dorsal view of A at higher magnification showing in greater detail the localization of G50 mRNAs in premigratory (arrow) and early migratory neural crest cell populations (arrowhead). C: Lateral view of a stage 21 embryo stained for Xenopus En-2 to localize the midbrain-hindbrain junction. D: Lateral view of a stage 21 embryo stained for G50. Expression of G50 mRNAs is seen in a stripe of cells at the height of the presumptive rhombomere 3, and in neural crest of the hyoid arch (h). E: Lateral view of a stage 21 embryo stained for Xenopus Krox-20. Two stripes of cells in the hindbrain corresponding to the presumptive rhombomeres 3 and 5, and neural crest of anterior branchial arch (ab) are expressing XKroxPO mRNAs. F Lateral view of a stage 21 embryo stained simultaneously for G50 and XKroxPO. Labeling of stained tissues is as in D and E, respectively. The intensity of the background stain varies with respect to the length of incubation of the embryos in the chromogenic reaction. Embryos in C and E were developed for 1 hr, while the other embryos were incubated 16 hr to obtain optimal staining. The stars in C and F indicate staining artifacts. Scale bars: A = 160 pm; 0 = 80 pm; C F = 144 pm.
Image published in: Brändli AW and Kirschner MW (1995)
Copyright © 1995. Image reproduced with permission of the Publisher, John Wiley & Sons.
| Gene | Synonyms | Species | Stage(s) | Tissue |
|---|---|---|---|---|
| epha2.L | LOC100191024, XE10 | X. laevis | Throughout NF stage 17 | hindbrain chordal neural plate posterior migratory neural crest cell premigratory neural crest cell |
| egr2.L | EGR-2, Krox-20, krox20, XKr20, XKrox-20 | X. laevis | Throughout NF stage 21 | rhombomere R3 rhombomere R5 anterior branchial crest |
| en2.L | En-2, en2-a, en2-b, eng2, engrailed 2, engrailed-2, engrailed homolog 2, maben, xen2 | X. laevis | Throughout NF stage 21 | presumptive midbrain-hindbrain boundary |
| epha2.L | LOC100191024, XE10 | X. laevis | Throughout NF stage 21 to NF stage 56 | rhombomere R3 hyoid crest mesenchyme tail region posterior neural tube |
Image source: Published
Permanent Image Page
Printer Friendly View
XB-IMG-84564