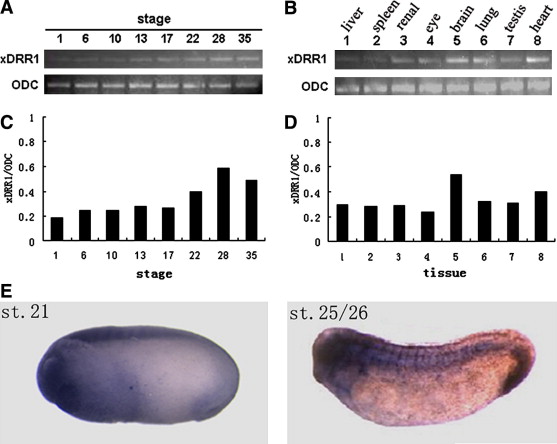
Fig. 2. Expression pattern of xDRR1 gene in developing embryos and tissues from an adult frog. (A) Temporal expression profile of the xDRR1 mRNA detected by RT-PCR. (B) Tissue expression profile of xDRR1. The relative expression ratio of xDRR1 was shown in Xenopus different developing stages (C) and several different organs (D). The ODC expression was taken as control. (E) Spatial expression of xDRR1 using whole-mount in situ hybridization analysis. Numbers indicate developmental stage. At stage 21, expression is mainly detectable in neuroectoderm. At stages 25/26, the transcripts are present in brain, heart, notochord, and somites.
This image is extracted from figure extracted from: Xenbase Image, This image is extracted from figure published in: Zhao XY et al. (2007), Image published in: Zhao XY et al. (2007)
Copyright © 2007. Image reproduced with permission of the Publisher, Elsevier B. V.
| Gene | Synonyms | Species | Stage(s) | Tissue |
|---|---|---|---|---|
| fam107a.S | drr1, LOC108715936, tu3a, xdrr1 | X. laevis | Sometime during NF stage 21 to NF stage 26 | heart post-anal gut head neural tube somite |
Image source: Published
Permanent Image Page
Printer Friendly View
XB-IMG-156802