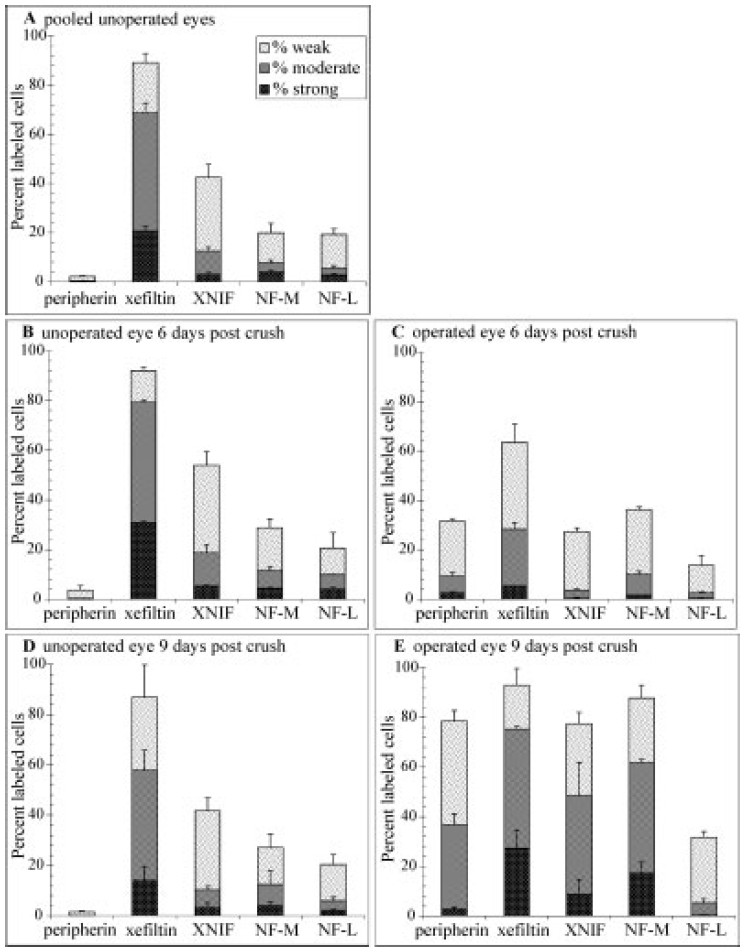
Fig. 3. Frequency of RGC labeling with probes to the five nIF mRNAs in control and operated eyes. Labeled RGC layer cells were scored according to intensity of labeling as weak, moderate, or strong. Percent labeled cells in each category are represented cumulatively as the mean SE. A: Values pooled from 10 contralateral control eyes at late stages of regeneration represent normal, unoperated eyes. Values in contralateral control (B), and operated eyes (C), 6 days after crush. Values in contralateral control (D) and operated eyes (E), 9 days after crush. The total percentages of labeled RGCs in the operated eye at this time were not significantly different between peripherin, xefiltin, XNIF, and NF-M (single factor ANOVA, df 6, P 0.48). Figure legend in A applies to all panels.
Image published in: Gervasi C et al. (2003)
Copyright © 2003. Image reproduced with permission of the Publisher, John Wiley & Sons.
Permanent Image Page
Printer Friendly View
XB-IMG-86775