XB-IMG-127775
Xenbase Image ID: 127775
|
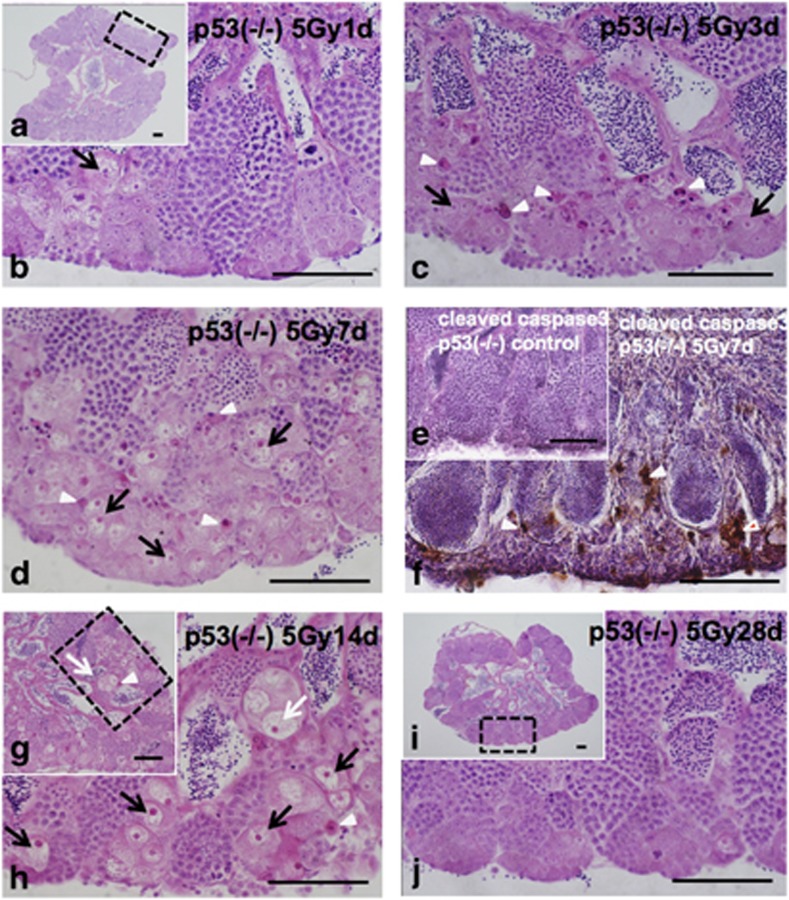
Figure 2. Histological changes of testis–ova in a p53(−/−) testis after 5 Gy γ-ray irradiation. Histological changes of testis–ova in a p53(−/−) testis during 28 days (1 month) after irradiation with 5 Gy of γ-rays. The arrowheads in c, d, f, g and h indicate the H&E-stained pyknotic cells, and arrows in c, d, g and h indicate the testis–ova. (a) H&E-stained section 1 day after irradiation. (b) Enlarged view of the boxed area in (a), showing that no apparent histological changes. (c) H&E-stained section 3 days after irradiation. (d) H&E-stained section 7 days after irradiation. H&E-stained pyknotic cells (arrowheads in d) that were positive in immunostaining against anticleaved caspase3 (arrowheads in f) in contrast to no positive signals in control p53(−/−) medaka (e), showing that these pyknotic cells are apoptotic. Testis–ova (arrows in d) increased extensively in the cysts of type A and early type B spermatogonia. (e) Immunostaining against anticleaved caspase3 in control p53(−/−) medaka testis. (g) H&E-stained section 14 days after irradiation. (h) Enlarged view of the boxed area in (g), showing that H&E-stained pyknotic cells (arrowheads in d, f, g and h) were observed continuously, and the larger size of testis–ova when compared with those 7 days after irradiation were observed (open arrows in g and h). (i) H&E-stained section of testis 28 days after irradiation. (j) Enlarged view of the boxed area in (i), showing that almost of all testis–ova had disappeared from the testis. Scale bars represent 50 μm Image published in: Yasuda T et al. (2012) Copyright © 2012 Macmillan Publishers Limited. Creative Commons Attribution-NonCommercial-NoDerivatives license Larger Image Printer Friendly View |