XB-IMG-124018
Xenbase Image ID: 124018
|
|
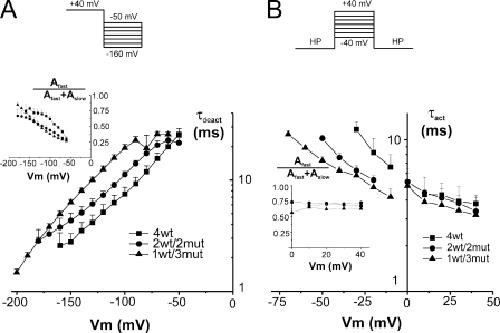
Figure 4. Time constant of activation and deactivation. (A) Deactivation time constants of heterotetramers compared with the 4wt tetramer. The currents were fitted with two exponentials. The weighted time constant is shown, and the inset represents the contribution of the fast time constant. 4wt data are shown as filled squares (n = 5), 2wt/2mut data are shown as filled circles (n = 8), and 1wt/3mut data are shown as filled triangles (n = 4). (B) Activation time constants of the heterotetramers compared with 4wt. The currents could be fitted with a single exponential for Vm lower than 0 mV but required two exponentials in the positive region. The weighted time constant is shown, and the inset represents the contribution of the fast component in the positive region. 4wt data are shown as filled squares (n = 3), 2wt/2mut data are shown as filled circles (n = 4), and 1wt/3mut data are shown as filled triangles (n = 5). The HP was −90 mV for 4wt and −120 mV for 2wt/2mut and 1wt/3mut. Note the log scale vertically. The applied voltage routine is shown in the top panel. Points are connected with lines for clarity. Cut-open voltage clamp measurements. For activation time constants, the experiments were performed at room temperature and in symmetrical 120 mM K+ to have larger currents in the negative region of voltage. Deactivation time constants were measured at 6–8°C; the internal and external solutions contained 120 and 50 mM K+, respectively. Image published in: Gagnon DG and Bezanilla F (2009) © 2009 Gagnon and Bezanilla. Creative Commons Attribution-NonCommercial-ShareAlike license Larger Image Printer Friendly View |