XB-IMG-127494
Xenbase Image ID: 127494
|
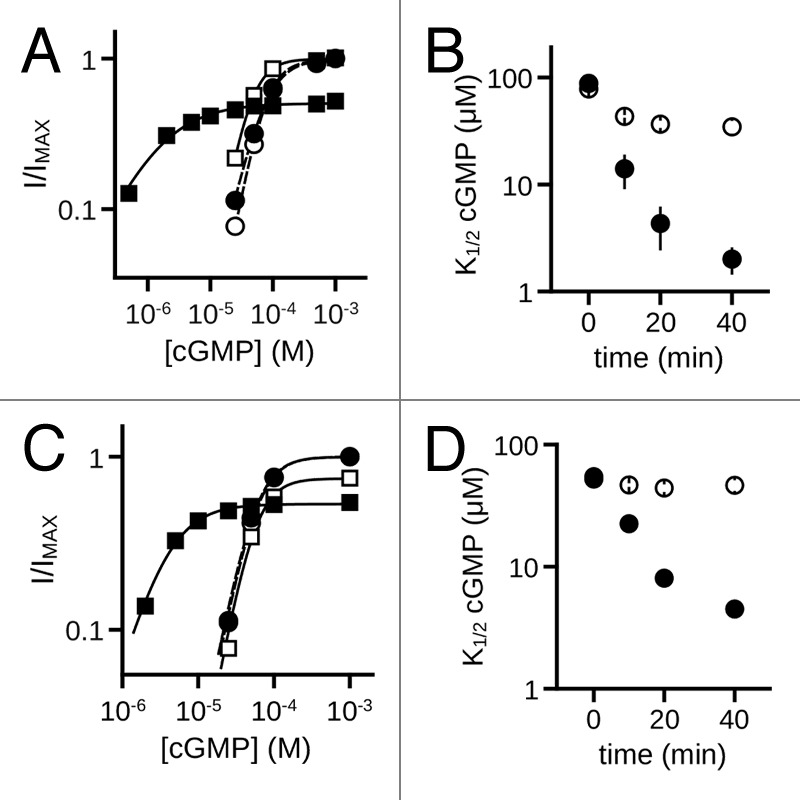
Figure 9. MMP9 increases the ligand sensitivity of rod homomeric CNGA1 and heteromeric CNGA1 + CNGB1 channels. (A) Representative dose-response curves for activation of control (open symbols) and MMP9 treated (closed symbols) A1 channels by cGMP at t0 (circles) and t40 (squares). Currents were normalized to the maximum t0 cGMP current. Parameters of best fit Hill curves (t0, hashed line; t40, solid line) for each condition shown are as follows: control, K1/2,t0 = 75.9 μM, nH = 2.2, IMAX = 1.0, K1/2,t40 = 43.9 μM, nH = 2.2, IMAX = 1.0; MMP9 K1/2,t0 = 75.3 μM, nH = 1.8, IMAX = 1.0, K1/2,t40 = 1.5 μM, nH = 0.9, IMAX = 0.50. (B) Time course for the change in cGMP apparent affinity of A1 channels for control (open circles) and MMP9-treated (filled circles) patches following excision. (C) Representative cGMP dose-response curves of control (open symbols) and MMP9 treated (closed symbols) A1+B1 channels at t0 (circles) and t40 (squares). Currents were normalized to the maximum t0 cGMP current. Parameters of best fit Hill curves (t0, hashed line; t40, solid line) for each condition shown are as follows: control, K1/2,t0 = 59.4 μM, nH = 2.3, IMAX = 1.0, K1/2,t40 = 55.6 μM, nH = 2.4, IMAX = 0.75; MMP9 K1/2,t0 = 57.2 μM, nH = 2.3, IMAX = 1.0, K1/2,t40 = 3.9 μM, nH = 1.5, IMAX = 0.53. (D) Time course for the change in cGMP apparent affinity of A1+B1 channels for control (open circles) and MMP9-treated (filled circles) patches following excision. Image published in: Meighan PC et al. (2012) Copyright © 2012 Landes Bioscience. Creative Commons Attribution-NonCommercial license Larger Image Printer Friendly View |