XB-IMG-120384
Xenbase Image ID: 120384
|
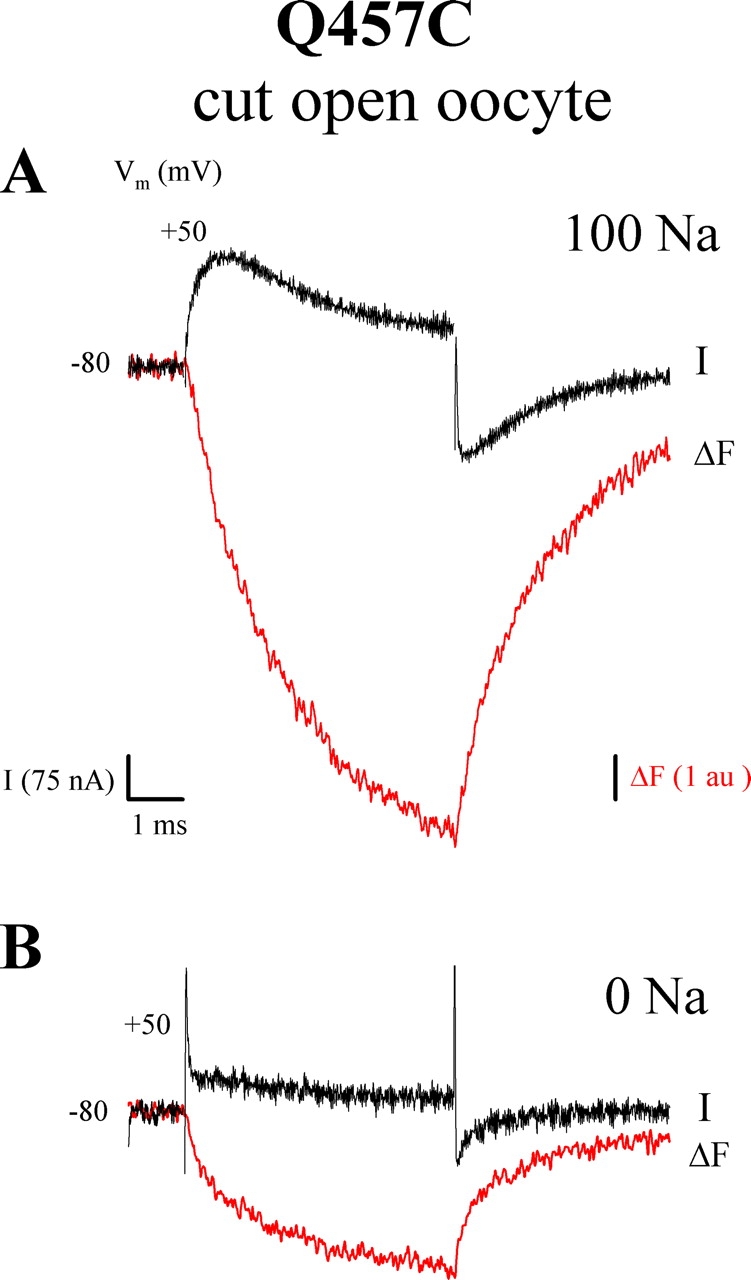
Figure 14. . Correlation between fast charge and fluorescence. The experiment was performed using the cut-open oocyte on TMR6M-labeled Q457C (from the oocyte of Fig. 6). Membrane potential was held at −80 mV and stepped to +50 mV. (A) Comparison of the rising phase of the presteady-state current (I) and fluorescence (ΔF) in 100 mM [Na+]o. I is from Fig. 6 A and ΔF is from Fig. 9 A. (B) Comparison of charge and ΔF in absence of Na+. I is from Fig. 6 B and ΔF is from Fig. 9 C. Image published in: Loo DD et al. (2005) Copyright © 2005, The Rockefeller University Press. Creative Commons Attribution-NonCommercial-ShareAlike license Larger Image Printer Friendly View |