XB-IMG-125877
Xenbase Image ID: 125877
|
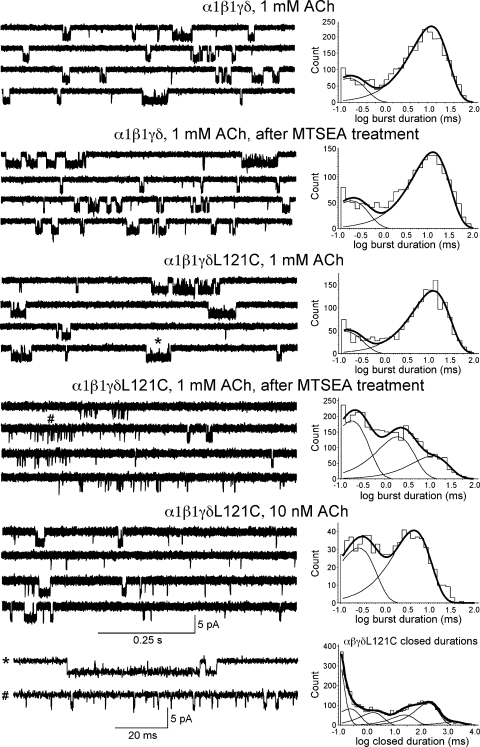
Figure 7. Single-channel traces and fit burst–duration histograms from wild-type α1β1γδ and α1β1γδL121C receptors before and after MTSEA treatment (5 mM for 60 s) as indicated. Bursts from α1β1γδL121C receptors before and after MTSEA treatment (indicated by * or #) are shown on the bottom row in higher time resolution together with the closed-duration histogram from α1β1γδL121C (before MTSEA treatment) used to define bursts. Currents were sampled at 100 kHz and ultimately low-pass filtered to 5 kHz. Each histogram represents the data pooled from at least individual four patches recorded under identical conditions, except for the 10-nM ACh concentration histogram, where data were pooled from three patches. Fit parameters are listed in Table IV. Image published in: Williams DK et al. (2011) © 2011 Williams et al. Creative Commons Attribution-NonCommercial-ShareAlike license Larger Image Printer Friendly View |