XB-IMG-125013
Xenbase Image ID: 125013
|
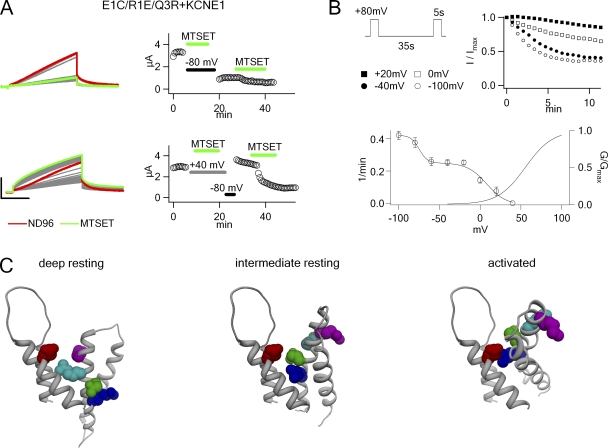
Figure 8. E1C/R1E/Q3R+KCNE1 currents after superfusion MTSET+. (A; left) Oocytes were held at either −80 or +40 mV, with perfusion of MTSET+ as indicated, followed by resumption of test pulses. Scale, 0.7 µA. (Right) Peak current amplitudes plotted against time. (B) Voltage dependence of MTSET+ modification. (Left) Pulse protocol used. The holding potential was varied. (Middle) Time course of MTSET+ modification at different holding potentials. (Right) Rates of MTSET+ modification plotted against holding potential. The rates were fit with a double Boltzmann function (see Materials and methods) with V1/2,a of −75 mV and slopea of 5 mV, and V1/2,b of 8 mV and slopeb of 8 mV. Error bars represent standard error of the means. G-V before MTS modification was also plotted. (C) Structures of the deep resting, intermediate resting, and activated states of Kv7.1 generated from molecular dynamics simulations and Poisson-Boltzmann continuum electrostatic calculations. Red, E1; magenta, R1; cyan, R2; green, R3; blue, R4. Image published in: Wu D et al. (2010) © 2010 Wu et al. Creative Commons Attribution-NonCommercial-ShareAlike license Larger Image Printer Friendly View |