XB-IMG-126638
Xenbase Image ID: 126638
|
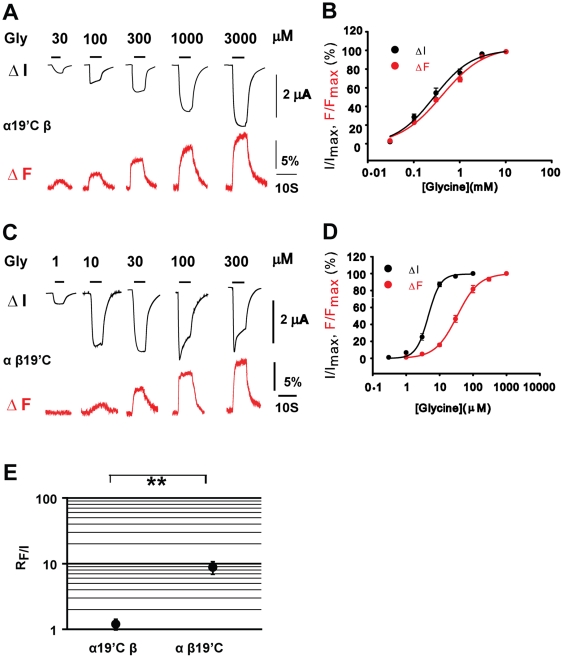
Figure 3. VCF of α1 β GlyRs.Example current and fluorescence traces of the α19′C β and α β19′C GlyRs are shown in (A) and (C), respectively. Averaged normalized glycine concentration-response curves of current and fluorescence of the α19′Cβ and α β19′C GlyRs are shown in (B) and (D), respectively. The RF/Is (the EC50 of fluorescence divided by the EC50 of current) of the α19′C β and α β19′C GlyRs are plotted (E). (** p<0.01 using the Student's t-test). Image published in: Shan Q et al. (2011) Shan et al. Creative Commons Attribution license Larger Image Printer Friendly View |