XB-IMG-122652
Xenbase Image ID: 122652
|
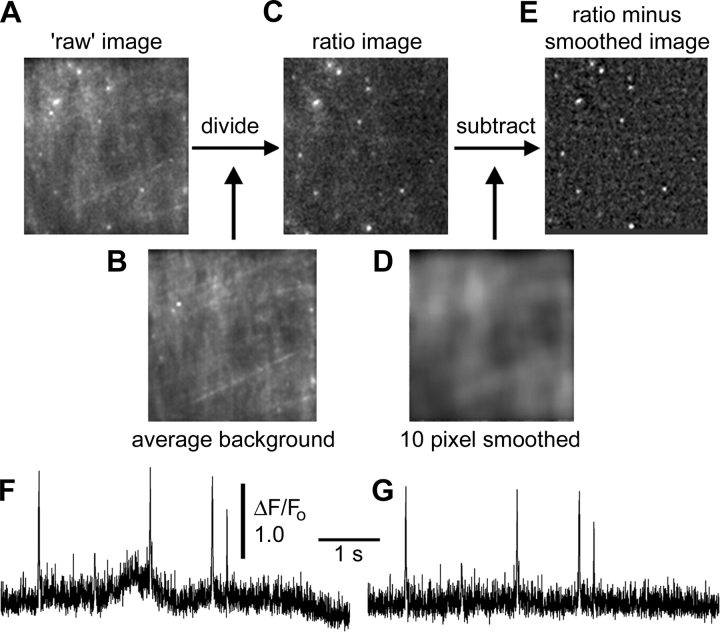
Figure 2. Image processing. (A–E) Illustration of processing steps. (A) Example of a “raw,” unprocessed frame acquired during polarization to −150 mV in the presence of ACh, showing several SCCaFTs. (B) Averaged image of background fluorescence, formed by averaging 100 frames at a holding potential of 0 mV before the hyperpolarizing step was applied to induce SCCaFTs. (C) Ratio image formed by dividing A by B. (D) Heavily smoothed (10 × 10 pixel) image formed from C. (E) Final, corrected image formed by subtracting D from C. For clarity of presentation, contrast settings are individually adjusted for each panel. (F) Representative example of SCCaFTs at a single channel site, derived from a sequence of ratio images like that in C. The trace represents mean fluorescence ratio within a region of interest (0.6 × 0.6 μm) centered on a channel. (G) Corresponding record from the same channel, derived after frame-by-frame subtraction of a heavily smoothed copy of each image as illustrated in E. Image published in: Demuro A and Parker I (2005) Copyright © 2005, The Rockefeller University Press. Creative Commons Attribution-NonCommercial-ShareAlike license Larger Image Printer Friendly View |