XB-IMG-122902
Xenbase Image ID: 122902
|
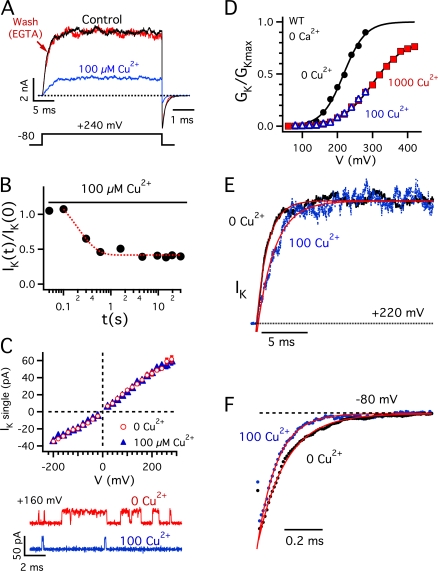
Figure 1. Extracellular Cu2+ inhibits mSlo1 activation. (A) Ik evoked in response to a pulse to +240 mV from a holding potential of −80 mV (0 Ca2+). Currents in 0 Cu2+ (control), 100 μM Cu2+, and washout with 5 mM EGTA were recorded from the same patch. Tail currents are shown on an expanded time scale, and have their own time scale bar. (B) The time course of inhibition by 100 μM Cu2+ was measured with a double pulse protocol. The ratio of steady-state IK during two 30-ms test pulses to +220 mV is plotted against the interval between pulses (t). Cu2+ was applied at −80 mV with rapid perfusion immediately following the first test pulse (t = 0). IK is inhibited rapidly (τ = 0.2 s, dotted curve) following a delay of ∼0.1 s likely representing the time for Cu2+ to reach the patch. (C) Single channel IK-V relation is unaffected by 100 μM Cu2+ (top). Representative traces at +160 mV from a single channel patch show a marked decrease in PO (bottom). (D) Normalized GK-V relations determined in 0 Cu2+ (•), 100 μM Cu2+ (▵), and 1000 μM Cu2+ (▪) for the same patch are fit by Boltzmann functions (0 Ca: GKmax = 1, V0.5 = 218 mV, Zapp = 0.82 e; 1000 Cu2+: GKmax = 0.81, V0.5 = 300 mV, Zapp = 0.57 e). (E) Normalized outward IK at +220 mV and (F) tail currents at −80 mV in 0 Cu2+ and 100 μM Cu2+ are fit by exponential functions. 100 μM Cu2+ increased the activation time constant 1.6-fold from 1.25 to 1.98 ms and decreased the deactivation time constant 1.4-fold from 153 to 108 μs. Image published in: Ma Z et al. (2008) © 2008 Ma et al. Creative Commons Attribution-NonCommercial-ShareAlike license Larger Image Printer Friendly View |