XB-IMG-129624
Xenbase Image ID: 129624
|
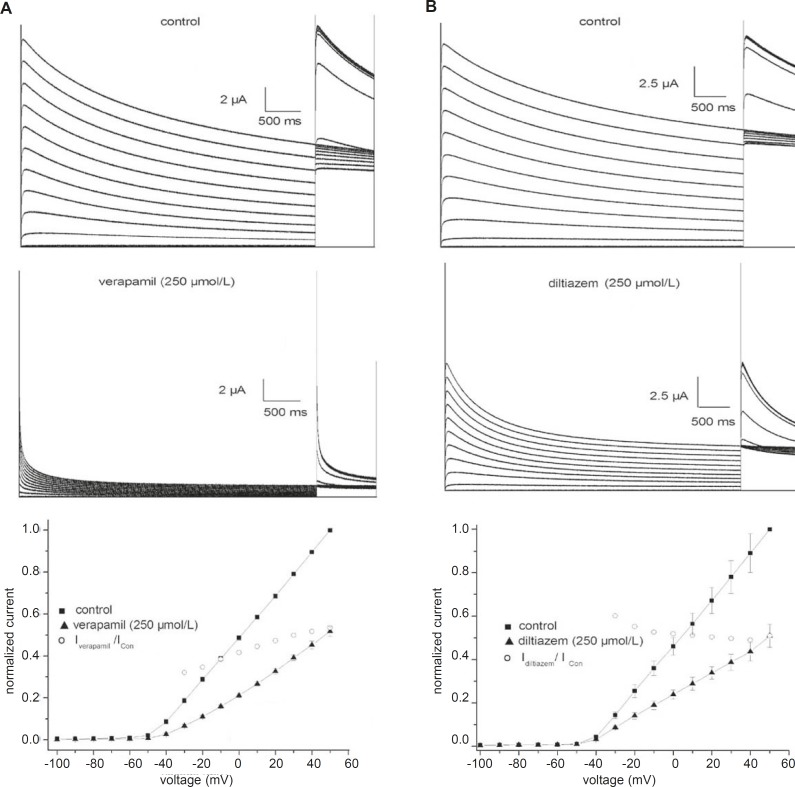
Figure 1. Effects of verapamil (A) and diltiazem (B) on fKv1.4ΔN channels expressed in Xenopus oocytes. Representative curves are shown for 5-second depolarizing pulses from -90 mV to voltages between –100 and +50 mV in steps of 10 mV. Upper panels: traces recorded under control conditions. Middle panels: current traces obtained in the presence of 250 μmol/L verapamil or 250 μmol/L diltiazem. The peak currents in the presence of verapamil and diltiazem were poorly resolved from the capacitance transient on this time scale. Bottom panels: effects of 250 μmol/L verapamil and 250 μmol/L diltiazem on the peak current-voltage (I-V) relationships. Currents were normalized to the peak current at +50 mV under control conditions. The IDrug/IControl ratio was plotted as a function of the membrane potential. Data are shown as mean ± SEM (n = 5). Image published in: Chen H et al. (2013) © 2013 by School of Pharmacy, Shaheed Beheshti University of Medical Sciences and Health Services. Creative Commons Attribution license Larger Image Printer Friendly View |