XB-IMG-124928
Xenbase Image ID: 124928
|
|
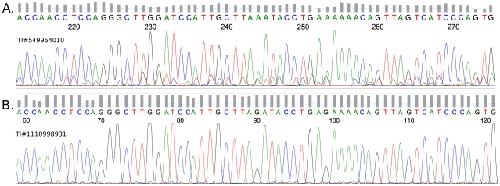
Figure 2. G-to-A sequencing artifact.(A) A chromatogram, from a trace matching the criteria in Figure 1B. An AAA motif is centered at position 244 and corresponds with position 90 in the control; another AAA motif occurs at position 253 which corresponds to position 99 in the control. It can be seen that each peak in this chromatogram is preceded by a smaller, identical sub-peak. This has the effect of making it likely that a normally small peak (see control) will be overwhelmed by the sub-peak of the adjacent, normally tall peak (see control). (B) A chromatogram from a control trace that matches the reference—position 90 is the center of an AGA motif. Image published in: Zaranek AW et al. (2010) Zaranek et al. Creative Commons Attribution license Larger Image Printer Friendly View |