XB-IMG-125803
Xenbase Image ID: 125803
|
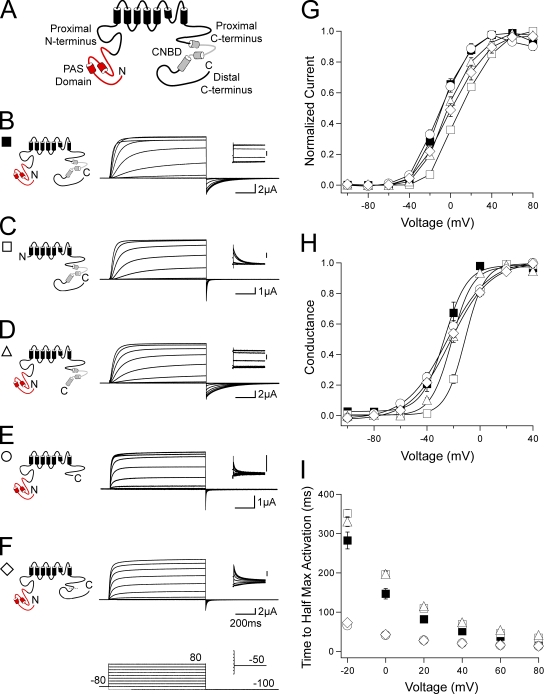
Figure 1. hERG activation gating is altered by C-terminal CNBD deletion. (A) Schematic of the hERG K+ channel with relevant N- and C-terminal domains indicated. (B–F) Channel schematics and two-electrode voltage-clamp recordings of a family of currents from hERG (B), hERG ΔN (C), hERG Δdistal C (D), hERG ΔCNBD/distal C (E), and hERG ΔCNBD (F). Currents were elicited using the pulse protocols indicated. Insets showing tail currents at −50 mV are 200 ms in duration; inset scale bars are 0.5 μA. (G) I-V relationship for B–F. The currents at the end of each depolarizing pulse were normalized to the peak current for that cell and plotted versus voltage. n ≥ 4 for each. (H) The steady-state voltage dependence of activation (G-V) for B–F. The instantaneous tail currents at −50 mV were normalized to the peak instantaneous tail current for that cell and plotted versus voltage. n ≥ 5 for each. Data were fit with a Boltzmann function to determine the V1/2 and k (slope) values. (I) Plot of the time to half-maximal activation versus voltage for B–F. n ≥ 4 for each. For G–I, the values are plotted as the means ± SEM. The error bars are within the points if not visible. Image published in: Gustina AS and Trudeau MC (2011) © 2011 Gustina and Trudeau. Creative Commons Attribution-NonCommercial-ShareAlike license Larger Image Printer Friendly View |