XB-IMG-127446
Xenbase Image ID: 127446
|
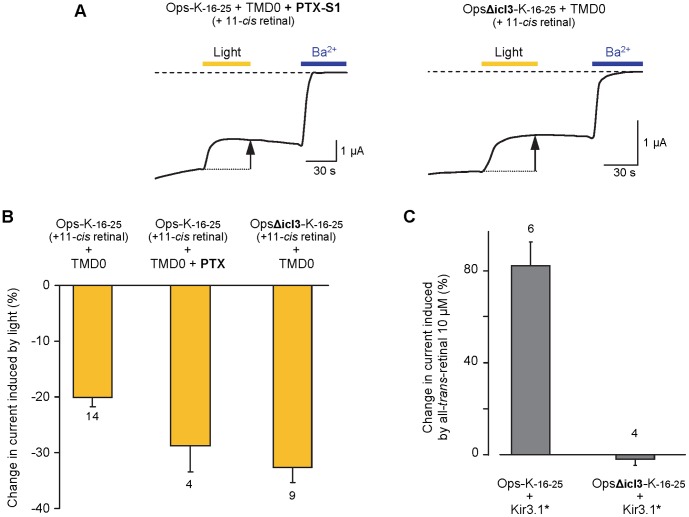
Figure 4. ICCRs report conformational changes of receptors deficient in G protein coupling.(A) Representative TEVC traces. Yellow and blue bars correspond to oocyte illumination and Ba2+ (3 mM) application, respectively. PTX (Pertussis Toxin) ADP-ribosylates Gαi/o proteins, thus preventing Gα-Gβγ dissociation. OpsΔicl3 is a rhodopsin mutant with a deletion in the third intracellular loop (Δ244–249) known for its inability to activate G proteins. Dashed line indicates the Ba2+-sensitive current baseline. Measurements were done at −50 mV. (B) Percent change in current induced by light after 11-cis retinal incubation in the dark. Numbers below bars indicate the number of oocytes tested. The responses of OpsΔicl3-K-16–25 and Ops-K-16–25+ PTX were not statistically different (Student t-test; P>0.5) while those of OpsΔicl3-K-16–25 and Ops-K-16–25 were different (P<0.002). (C) Oocytes were co-injected with Ops-K-16–25+ Kir3.1* or OpsΔicl3-K−16–25+ Kir3.1*. Ability of opsin to activate G proteins was determined by the addition of all-trans-retinal at 10 µM and measurement of Kir3.1* activation as a percent change in current. Numbers above bars indicate the number of oocytes tested. Image published in: Caro LN et al. (2012) Image reproduced on Xenbase with permission of the publisher and the copyright holder. Creative Commons Attribution license Larger Image Printer Friendly View |