XB-IMG-124736
Xenbase Image ID: 124736
|
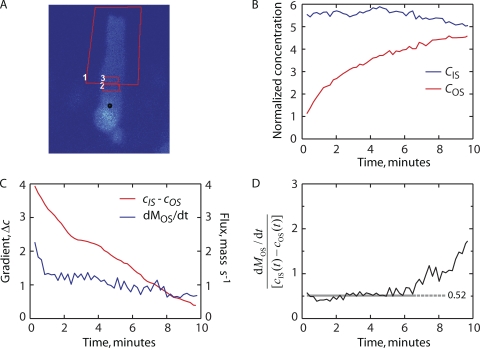
Figure 8. Flux of PAGFP through the CC. (A) Pre-photoconversion image of a rod
showing the regions where fluorescence was monitored over time. (B)
Relative concentration of photoactivated PAGFP in the IS (region 2) and
OS (region 3) after an IS photoconversion pulse. (C) The concentration
gradient (red line, left ordinate) and flux (blue line, right ordinate)
of PAGFP between IS and OS compartments. (D) The “flux
constant” (Eq.
10) as a function of time. Gray line indicates the average value
over the first 6.5 min (0.52 µm3
s−1), after which the
cIS-cOS
difference fell below ∼10% of its original magnitude and became
unreliable. Image published in: Calvert PD et al. (2010) © 2010 Calvert et al. Creative Commons Attribution-NonCommercial-ShareAlike license Larger Image Printer Friendly View |