XB-IMG-117389
Xenbase Image ID: 117389
|
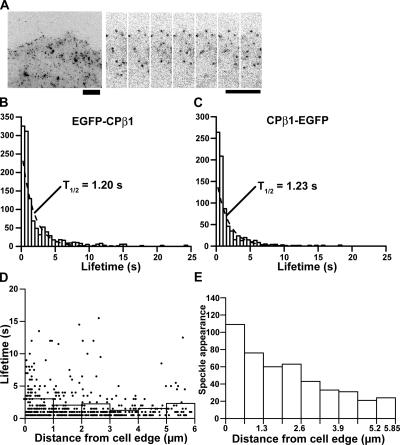
Figure 1. Lifetime distribution of single-molecule CP speckles in lamellipodia. (A) Speckle images in an XTC cell expressing a low amount of EGFP-CPβ1 (left) and associated time-lapse images at intervals of 500 ms (right). (B and C) Speckle lifetime distribution of EGFP-CPβ1 (n = 1,195) in two cells (B) and CPβ1-EGFP (n = 793) in three cells (C). CP speckles with single EGFP intensity, which appeared over the course of a 15-s time window, were followed. Bars show the number of speckles with indicated lifetimes after normalization for photobleaching. Dashed lines show the single exponential curve fit with lifetime distribution data between 1.0 and 5.5 s, and its decay rate is expressed as half-life (t1/2). (D) Lifetime versus position plot of CP speckle lifetime data. Dots represent the lifetime and emerging position of individual EGFP-CPβ1 speckles. Bars represent the mean speckle lifetime after correction for photobleaching. A representative result of two independent measurements is shown. (E) The position of EGFP-CPβ1 speckles that had appeared over 30 consecutive images was recorded. Bars represent the number of newly emerged CP speckles in each indicated position. A representative result of three independent measurements is shown. Bars, 5 μm. Image published in: Miyoshi T et al. (2006) Copyright © 2006, The Rockefeller University Press. Creative Commons Attribution-NonCommercial-ShareAlike license Larger Image Printer Friendly View |