XB-IMG-124880
Xenbase Image ID: 124880
|
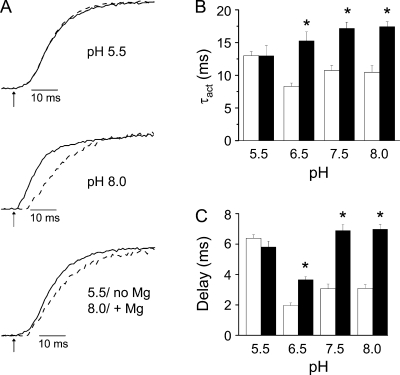
Figure 7. Low pH abolishes Mg2+ modulation of activation kinetics in E283A+I287D+F324D channels. (A) Representative currents recorded at pH 5.5 (top) or pH 8.0 (middle) at +20 mV in the absence (solid trace) or at +30 in the presence (+20 mV at pH 5.5 only) (dashed trace) of Mg2+ have been scaled and overlaid. (Bottom) Representative currents recorded at pH 5.5 in the absence of Mg2+ (solid trace; +20 mV) or at pH 8.0 in the presence of Mg2+ (dashed trace; +30 mV) have been scaled and overlaid. Arrows indicate start of voltage pulse (t = 0). (B) Bar graph shows τact values measured at pH 5.5, 6.5, 7.5, or 8.0 in the absence (open bars; +20 mV) or presence (filled bars; +30 mV, except for +20 mV at pH 5.5) of Mg2+. Data are provided as mean ± SEM; n = 8–11. Asterisk (*), τact values measured in the presence and absence of Mg2+ differ significantly; P < 0.05 by ANOVA. Values of τact for E283A+I287D+F324D in the absence of Mg2+ were 13 ± 1 ms (pH 5.5), 8 ± 1 ms (pH 6.5), 11 ± 1 ms (pH 7.5), and 10 ± 1 ms (pH 8). Values of τact for E283A+I287D+F324D in the presence of Mg2+ were 13 ± 2 ms (pH 5.5), 15 ± 1 ms (pH 6.5), 17 ± 1 ms (pH 7.5), and 17 ± 1 ms (pH 8). (C) Bar graph shows delay before pore opening measured at pH 5.5, 6.5, 7.5, or 8.0 in the absence (open bars; +20 mV) or presence (filled bars; +30 mV, except for +20 mV at pH 5.5) of Mg2+. Data are provided as mean ± SEM; n = 8–14. Asterisk (*), delay values measured in the presence and absence of Mg2+ differ significantly; P < 0.05 by ANOVA. Values of the delay for E283A+I287D+F324D in the absence of Mg2+ were: pH 5.5, 6.4 ± 0.2 ms; pH 6.5, 2.0 ± 0.2 ms; pH 7.5, 3.1 ± 0.3 ms; pH 8.0, 3.1 ± 0.2 ms. Values of the delay for E283A+I287D+F324D in the presence of Mg2+ were: pH 5.5, 5.8 ± 0.4 ms; pH 6.5, 3.7 ± 0.2 ms; pH 7.5, 6.9 ± 0.4 ms; pH 8.0, 7.0 ± 0.3 ms. Image published in: Lin MC et al. (2010) © 2010 Lin et al. Creative Commons Attribution-NonCommercial-ShareAlike license Larger Image Printer Friendly View |