XB-IMG-124093
Xenbase Image ID: 124093
|
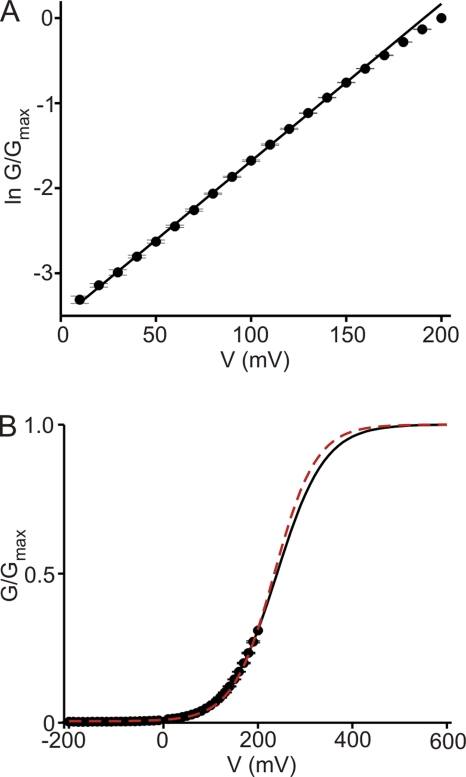
Figure 10. Voltage dependence of the activation of E363Q mutant channels exposed to a saturating cGMP concentration. (A) Semilogarithmic plot of relative conductance against voltage between 10 and 200 mV (taken from Fig. 3 C). The data points from 10 to 150 mV were fitted with a straight line, yielding a valence of 0.47 ± 0.01 (mean ± SEM; n = 5); the rest of the line was extrapolated. (B) Entire G-V curve (mean ± SEM; n = 5) of the E363Q mutant in the presence of 2 mM cGMP taken from Fig. 3 C. Black curve superimposed on the plot of relative conductance against voltage is a Boltzmann function fit yielding Z = 0.51 ± 0.01 and V1/2 = 240 ± 7 mV. Red dashed curve is a simulation of Eq. 2 with K1 = 5 × 10⁻³, K2 = 1.04, and ZK2 = 0.58 (taken from Table II). The asymptotic maximum was rescaled to one to produce the plot. Image published in: Martínez-François JR et al. (2009) © 2009 Martínez-François et al. Creative Commons Attribution-NonCommercial-ShareAlike license Larger Image Printer Friendly View |