XB-IMG-178584
Xenbase Image ID: 178584
|
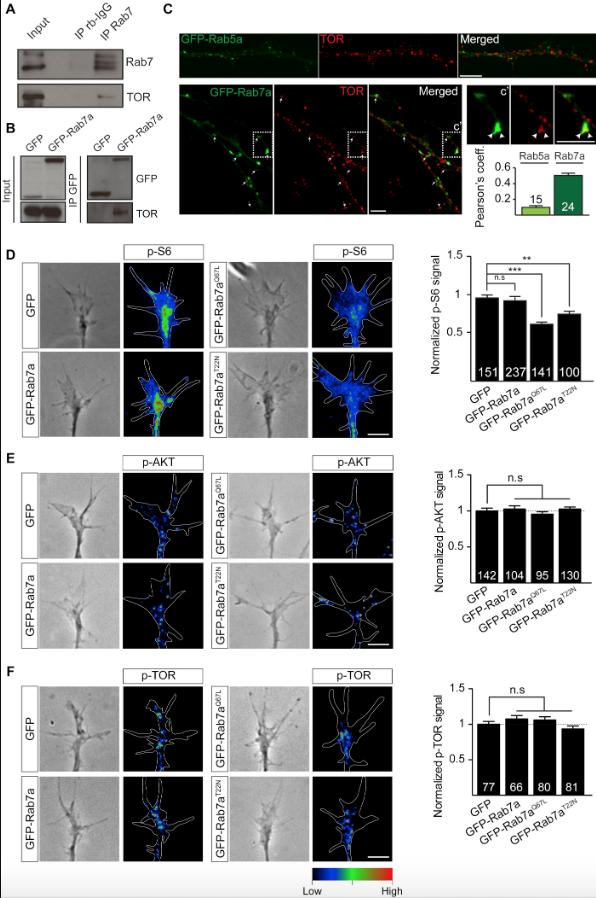
Figure S4. Perturbing Rab7a Function Disrupts Signaling Downstream of TOR Complex 1 in RGC Axons, Related to Figure 3
(A) Co-immunoprecipitation between endogenous Rab7 and TOR in brain lysates.
(B) Co-immunoprecipitation between GFP-Rab7a and TOR in brain lysates.
(C) Representative immunocytochemistry images showing TOR signals in RGC axons expressing GFP-Rab5a or GFP-Rab7a. Pearsonâs coefficient between endosomal markers and TOR.
(D) Representative phase contrast images and heat maps indicating relative phospho-S6 levels in growth cones expressing Rab7a mutants. GFP-Rab7aQ67L or GFP-Rab7aT22N expression decreases the amount of phospho-S6 ribosomal proteins in growth cones compared to GFP or GFP-Rab7a-expressing growth cones.
(E) Representative phase contrast images and heat maps indicating relative phospho-AKT levels in growth cones expressing Rab7a mutants. GFP-Rab7a, GFP-Rab7aQ67L or GFP-Rab7aT22N expression does not affect the amount of phospho-AKT in growth cones compared to the GFP control.
(F) Representative phase contrast images and heat maps indicating relative phospho-TOR levels in growth cones expressing Rab7a mutants. GFP-Rab7a, GFP-Rab7aQ67L or GFP-Rab7aT22N expression does not affect the amount of phospho-TOR in growth cones compared to the GFP control. n=number of axon segments in C, or n=number of growth cones in D, E, F. Mean±s.e.m.; n.s., not significant, ââP<0.01, âââP<0.001, Mann-Whitney test. Scale bars: 5μm. Larger Image Printer Friendly View |