XB-IMG-124948
Xenbase Image ID: 124948
|
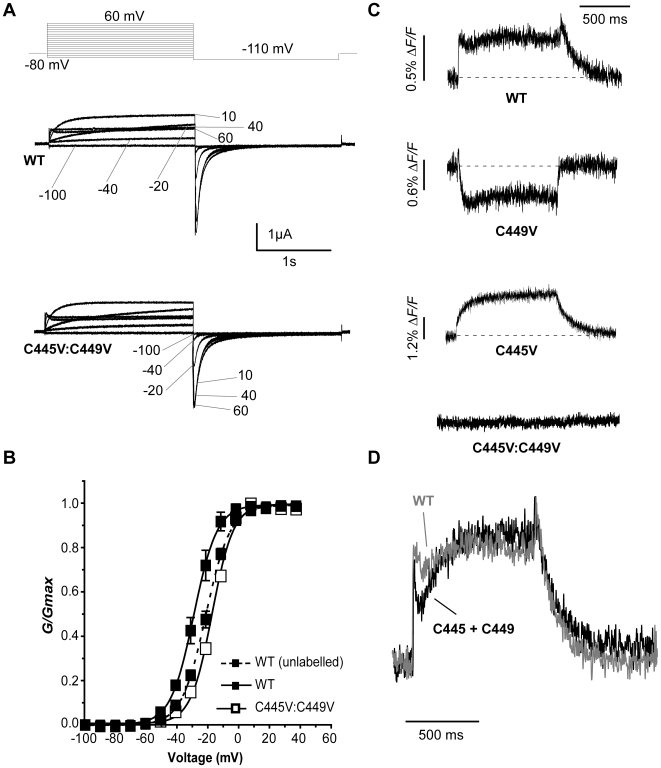
Figure 2. Endogenous cysteine residues are accessible to TMRM labelling.(A) Representative hERG currents (WT and C445V:C449V) evoked by 2 s depolarizing steps from −80 to potentials ranging from −100 to 60 mV. Membrane was then hyperpolarized at −110 mV for 2 s. (B) Comparison of WT and C445V:C449V G-V curves with (solid line) and without (dotted line) TMRM labelling, obtained by plotting the maximum tail current against voltage (WT unlabelled V½ = −19.7±1.2 mV and k = 8.1±0.2, n = 5; WT labelled V½ = −27.5±2.0 mV and k = 7.7±0.7, n = 3; C445V:C449V V½ = −15.7±0.7 mV and k = 7.1±0.3, n = 6). (C) Representative TMRM fluorescence traces recorded during 1 s depolarizations from −80 to +40 mV and then repolarized to −110 mV from: WT channels, channels with one cysteine (C449V, C445V), and channels with both cysteines removed (C445V:C449V). Note that C445V:C449V channels no longer fluoresce. (D) Arithmetic addition of fluorescence reports from C445V and C449V (black) compared to the WT signal (gray). Image published in: Es-Salah-Lamoureux Z et al. (2010) Es-Salah-Lamoureux et al. Creative Commons Attribution license Larger Image Printer Friendly View |