XB-IMG-178521
Xenbase Image ID: 178521
|
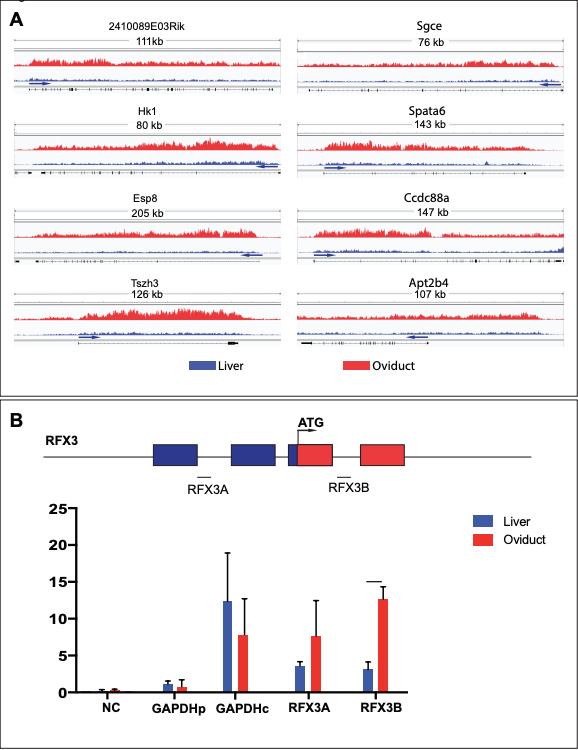
Figure S10: Chip-qPCR confirms increased H2B ubiquitination in ciliated cells
(A) The H2Bub1 binding profiles, depicted using fold enrichment against random
distribution values ranging from 0 to 10, across the eight most significant cilia genes based on enrichment of H2Bub1 occupancy in ciliated tissue (oviduct, shown in red) compared to non-ciliated tissue (liver, shown in blue) according to Chip-seq. The arrows indicate the transcription start site.
(B) ChIP-qPCR of mouse oviducts and liver with anti-H2Bub1 antibody. qPCR primers: NC (non-specific primers), GAPDHp (negative control), GAPDHc (positive control), RFX3A and RFX3B are RFX3 specific primers; blue boxes are 5'UTR, red boxes are the coding region. Chip qPCR was performed in ciliated (oviducts-red) and nonciliated (liver-blue) tissues from Rnf20+/+ and Rnf20+/- mice. Results are from 4 independent experiments, unpaired T-test, ***p<0.0005. Image published in: Robson A et al. (2019) Copyright © 2019. Image reproduced with permission of the Publisher and the copyright holder. This is an Open Access article distributed under the terms of the Creative Commons Attribution License. Larger Image Printer Friendly View |