XB-IMG-127279
Xenbase Image ID: 127279
|
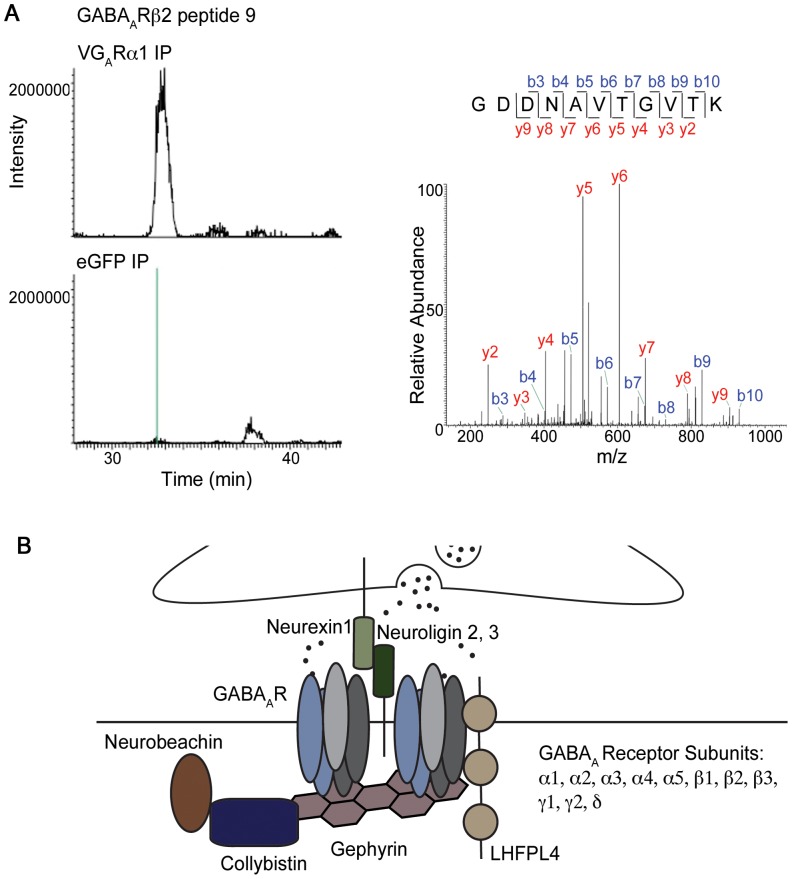
Figure 5. Mass spectrometry identifies proteins present at tagged inhibitory synapses.(A) All peptides were evaluated individually, for their presence or absence in the sample isolated via VGABAARα1 or eGFP, using information from peptide fragmentation spectrum (MS/MS), peptide mass spectrum (MS), and peptide retention time in extracted ion chromatogram. An example is shown for peptide, GDDNAVTGTK, from GABAARβ2. V: Venus. GAR: GABAA receptor. (B) Schematic representation of the cortical inhibitory synaptic protein complex. These synapses contain a multitude of inhibitory receptors, as well as cell signaling and adhesion proteins, but are entirely lacking in cell signaling molecules. The localization of LHFPL4 and Neurobeachin is hypothetical. Complete information on each peptide is in Table 1 and Figure S2 and Table S1. Image published in: Heller EA et al. (2012) Heller et al. Creative Commons Attribution license Larger Image Printer Friendly View |