XB-IMG-123576
Xenbase Image ID: 123576

|
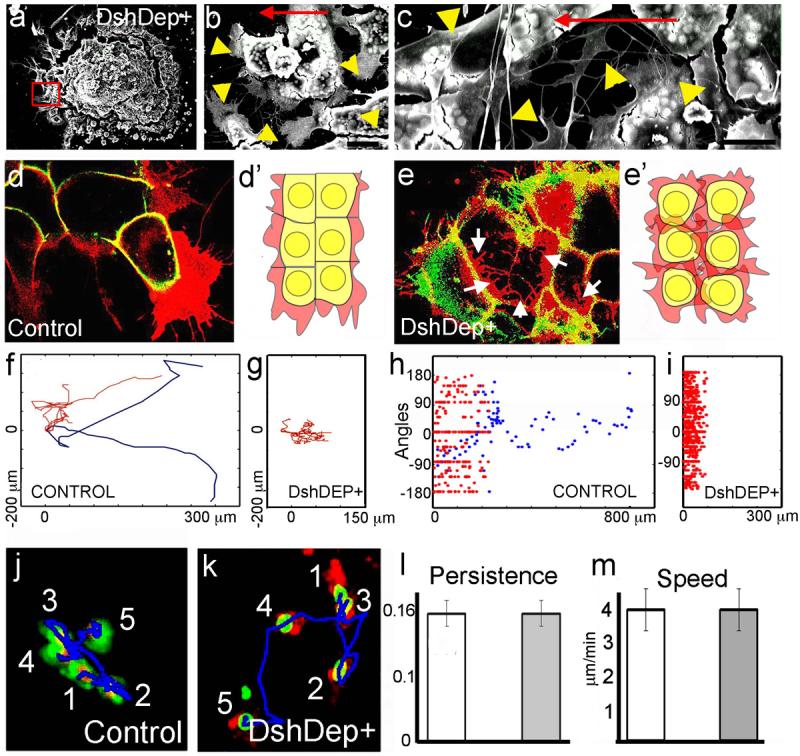
Figure 3. Effect of PCP signalling on cell contacts(a-c). SEM of Xenopus cultured NC expressing DshDep+. Red square indicates leading cells. Higher magnification views of other leading cells are shown in b and c. Arrowheads: cell protrusions; arrow: direction of migration. Bars: 25μm in b, 50μm in c. (d, e) Two-Plane Confocal image to show cell protrusions (red) and cell shape (green). Cell protrusions are produced only at the border of the control explant (d), while they are observed between the DshDep+ cells (arrows in e). (d', e') Schematic representation of d and e. (f-i) Analysis of tracks of migrating NC cells. Blue: leading cells; red: trailing cells. Tracks of control (f) or DshDep+ (g) cells. Distribution of angles of migration for leading (blue) and trailing (red) control (h) or DshDep+ (i) cells versus the distance from the origin. (j-m) Analysis of migration of dissociated NC cells. (j, k) Five frames taken every 10 min were overlapped for a control cell (j) and a DshDep+ cell (k). Numbers: consecutive position of the cell. Blue line: track. Persistence (l) and Speed (m) were calculated for control (white bar) and DshDep+ (grey bar) cells. (p<0.05; n= 62). Image published in: Carmona-Fontaine C et al. (2008) Image downloaded from an Open Access article in PubMed Central. Image reproduced on Xenbase with permission of the publisher and the copyright holder. Larger Image Printer Friendly View |
