XB-IMG-122792
Xenbase Image ID: 122792
|
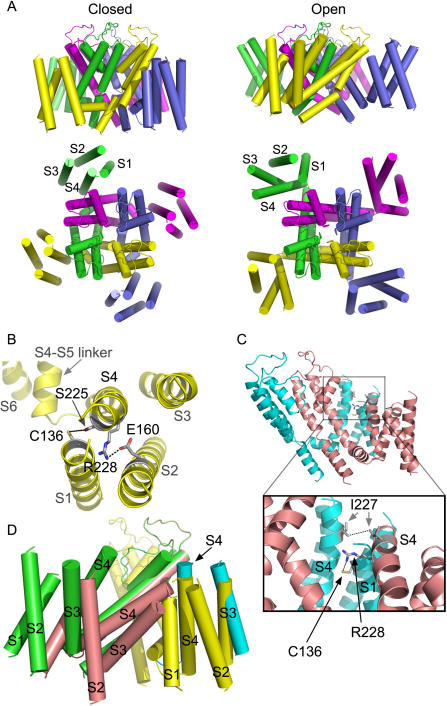
Figure 9. Plausible structural models accounting for the gating conformations of the voltage sensor domains of Kv7.1.(A) The closed (left) and open (right) conformations of Kv7.1 in side view (upper part) or top view (lower part). Each subunit is colored differently while alpha helices are shown as cylinders. (B) Top view of a subunit that reflects the closed state, where R228 becomes close to Glu160 (2.7 Å) and S255 to Cys136 (5.1 Å) within the same subunit. The indicated side chains are colored in CPK (grey, blue, red and yellow colors correspond to carbon, nitrogen, oxygen and sulfur atoms, respectively). (C) Side view of two adjacent subunits, which represent an intermediate open state (salmon) and an intermediate closed state (cyan). The two subunits are viewed from the inner part of the pore in horizontal outward direction. The inset shows the distance between Ile227 of two neighboring VSDs (5.2 Å) as well as the distance between R228 and Cys136 of the adjacent VSD (4.6 Å). (D) Adjacent VSDs in the open state (green), the intermediate open state (salmon), the intermediate closed state (cyan) and the closed state (yellow). Note that the VSD of the intermediate open state (salmon) tilts towards the neighboring VSD to interact with the S4 of the intermediate closed state (cyan), which undergoes axial rotation and translation from the closed state (yellow). Image published in: Haitin Y et al. (2008) Haitin et al. Creative Commons Attribution license Larger Image Printer Friendly View |