XB-IMG-118486
Xenbase Image ID: 118486
|
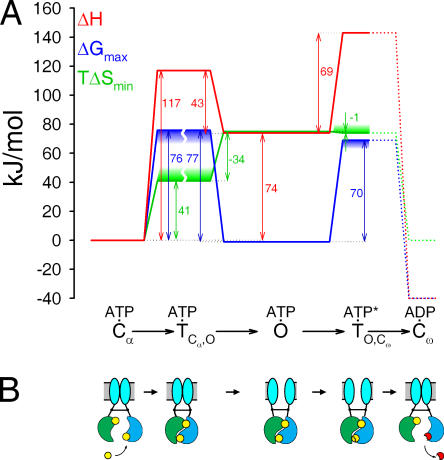
Figure 6. Energetic profile of gating of partially phosphorylated CFTR channels. (A) Profile of measured ΔH (red line), and computed ΔGmax (blue line), and TΔSmin (green line) for a partially phosphorylated CFTR channel as it transits from an initial ATP-bound closed state (Cα) through a transition state ( . Downward blue and upward green “smear” on the ΔGmax and TΔSmin lines, respectively, indicate the direction of possible error in those estimates; the breaks in those lines indicate uncertainty due to possible asymmetry in transmission coefficient κ (see text). Barrier heights from Cω back to O could not be measured (dotted lines); ΔG for Cω was tentatively drawn at ∼−40 kJ/mol relative to Cα to represent hydrolysis of ATP at physiologically relevant concentrations of ATP, ADP, and Pi. (B) Cartoon illustrating mechanistic interpretation of the thermodynamic profile. Opening of the pore (cyan vertical ovals in gray horizontal membrane) is a consequence of formation of an NBD1(green)/NBD2(blue) tight dimer, with two ATP molecules (yellow circles) sandwiched in the interface. Channel closure normally follows hydrolysis of the ATP at the composite NBD2 catalytic site (lower site) to ADP (red) + Pi, which causes disruption of the dimer. The transition state for opening represents a strained channel molecule in which the NBD dimer is already formed but the transmembrane pore (cyan) is still closed. The transition state for normal closure represents the transition state for hydrolysis of the β-γ bond of the ATP (broken yellow circle). Image published in: Csanády L et al. (2006) Copyright © 2006, The Rockefeller University Press. Creative Commons Attribution-NonCommercial-ShareAlike license Larger Image Printer Friendly View |