XB-IMG-127989
Xenbase Image ID: 127989

|
|
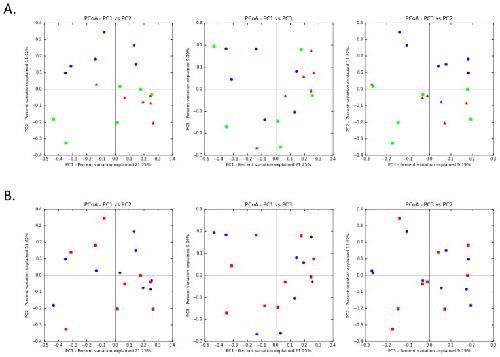
Figure 4. Principal Coordinates Analysis (PCoA) of unweighted UniFrac distances of 16S rRNA gene sequencingThe analysis was performed on a randomly selected subset of 1800 sequences per sample. A. Stomach (blue circles) samples separated from small (green square) and large (red triangle) intestine, indicative of distinct flora. B. No such separation was seen between non-thymectomized (blue circle) and thymectomized (red square) samples. Image published in: Mashoof S et al. (2013) Image downloaded from an Open Access article in PubMed Central. Image reproduced on Xenbase with permission of the publisher and the copyright holder. Larger Image Printer Friendly View |
