XB-IMG-153566
Xenbase Image ID: 153566
|
||||||||
|
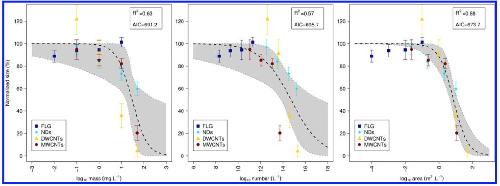
Figure 2. Growth inhibition in X. laevis larvae after a 12 day exposure to FLG, NDs, DWCNTs, and MWCNTs. Normalized size (%) is plotted vs the base-10 logarithms of three different metrics: mass concentration (mg·Lâ1), number concentration (Lâ1), and surface area concentration (m2·Lâ1). Black dashed lines represent nonlinear regression model predictions, and shaded areas are 95% confidence intervals (CIs) on these. The 95% CIs on the mean sizes, which were computed from the experimental assays, are represented as vertical error bars.
(Reprinted with permission from Nano Letters, Copyright 2016, American Chemical Society). Image published in: Mottier A et al. (2016) Copyright © 2016. American Chemical Society
Larger Image Printer Friendly View |