XB-IMG-123656
Xenbase Image ID: 123656
|
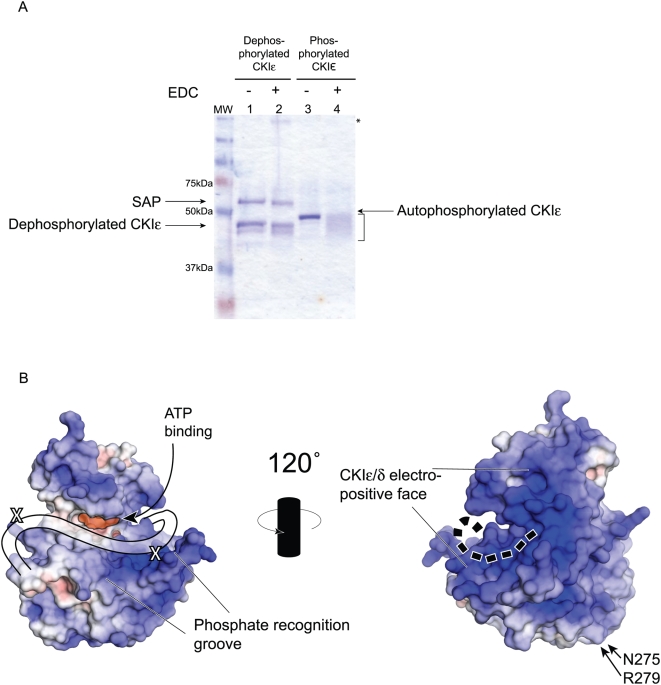
Figure 8. Analysis of the binding of the C-terminal tail.(A) Full-length CKIε was incubated with either SAP or ATP prior to reaction with the EDC crosslinker. Lane 2 shows that there is no change in the apparent molecular weight of dephosphorylated CKIε. In lane 4, there is marked change in the migration of autophosphorylated, crosslinked CKIε (bracketed). Asterisk shows a high molecular weight species that may correspond to SAP-CKIε oligomers (lane 2). (B) Space-filling models of CKIδ are shown. The APBS plugin for PyMol (DeLano Scientific LLC) was used to establish electrostatic potential of solvent exposed atoms. Positively charged areas are shaded blue and correspond to basic regions of the protein; negatively charged regions are red, and correspond to acidic areas. The highly basic groove that has been postulated to be a phosphate recognition region is conservered across the CKI family. The two identified cross-linked residues are indicated with an X. The cartoon line on the left side diagram shows the position of the first 20 amino acids of the tail based on the crosslinking data. The dotted line on the right side shows the proposed extension of the tail onto the backside of the kinase. Image published in: Dahlberg CL et al. (2009) Dahlberg et al. Creative Commons Attribution license Larger Image Printer Friendly View |