XB-IMG-171324
Xenbase Image ID: 171324
|
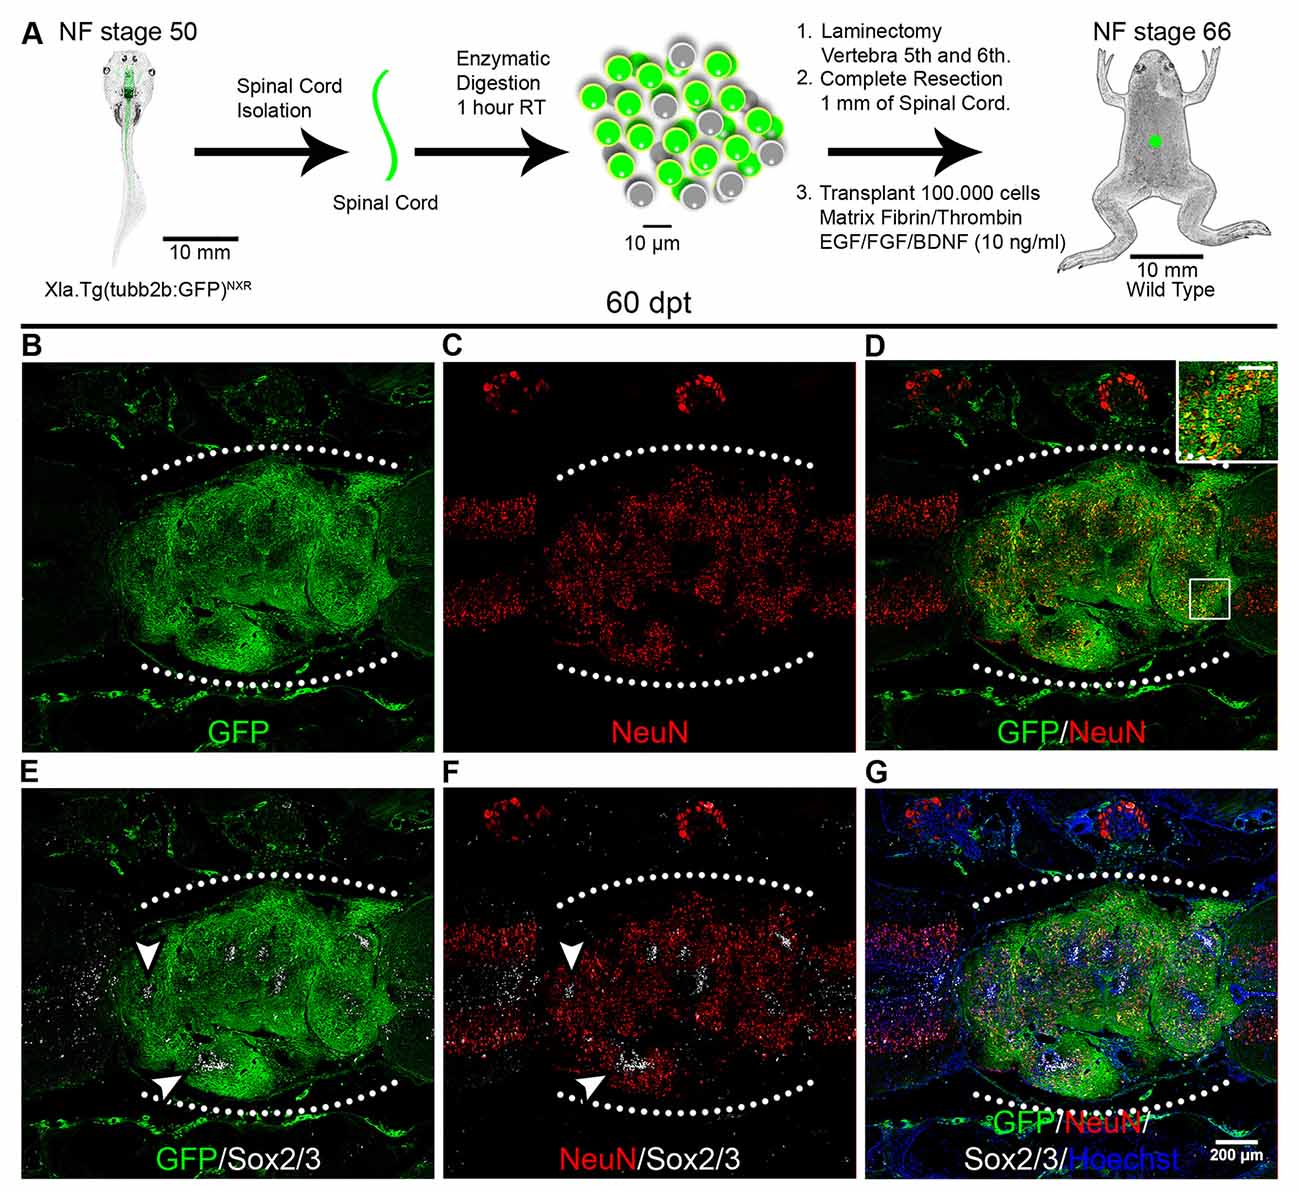
Figure 5. Donor cells differentiate into neurons after transplantation. (A) Diagram of a heterochronic transplantation experiment using the transgenic line Xla.Tg(tubb2b:GFP)NXR as donor. (B–G) Longitudinal sections of the spinal cord of NR-stage froglets that received cells from R-stage animals and were stained for GFP, NeuN, Sox2 and Hoechst. Inset in panel (D) showed co-localization of GFP and NeuN, scale bar 50 μm. Arrowheads indicate GFP negative regions expressing Sox2/3. The white dotted line indicated the transplantation site. Rostral is left and caudal right. Similar results were obtained in two independent experiments. Scale bar 200 μm. Image published in: Méndez-Olivos EE et al. (2017) Copyright © 2017 Méndez-Olivos, Muñoz and Larraín. Creative Commons Attribution license Larger Image Printer Friendly View |