XB-IMG-121180
Xenbase Image ID: 121180
|
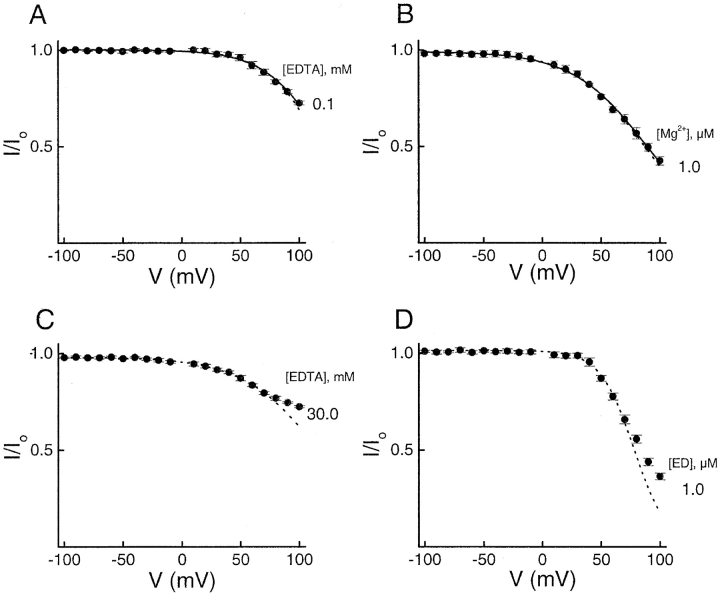
Figure 7. . Comparisons of channel block by “EDTA” with block by Mg2+ or ethylenediamine. (A and C) Currents with 0.1 mM and 30 mM EDTA normalized to that with 5 mM EDTA are plotted against membrane voltage, respectively. (B and D) The fraction of unblocked currents in the presence of Mg2+ or ethylenediamine (ED), respectively, is plotted against membrane voltage. All data points are mean ± SEM (n = 5). All curves are fits of the equation I/Io = 1/(1 + [blocker]/Kd), where Kd = Kd(0 mV)e−ZFV/RT. For A and B, the two nearly superimposed curves for each data set are fits either all data points (continuous curves) or all but the rightmost three data points (dashed curves). For C or D, the dashed curve through each dataset is a fit to all but the rightmost three data points. Image published in: Guo D and Lu Z (2002) Copyright © 2002, The Rockefeller University Press. Creative Commons Attribution-NonCommercial-ShareAlike license Larger Image Printer Friendly View |