XB-IMG-121306
Xenbase Image ID: 121306
|
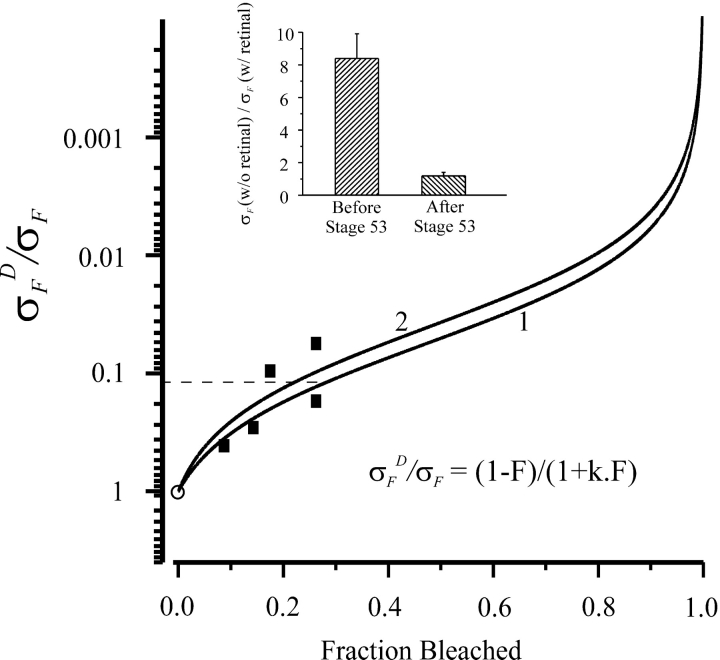
Figure 9. . Calculation of fractional free opsin in prestage 53 rods. The ratio of normalized flash sensitivity pre and postbleach, represented by , is plotted against fraction bleached and used as a standard, obtained from five poststage 53 cells indicated by filled squares. Same cells as those marked by triangles in Fig. 8; the point at zero fractional bleach (open circle) is simply a constraint for the curve fit. The stage, % bleach, and “steady-state” dark current before and after bleach of each cell were: stage 53, 17.5%, 13.9 pA, 7.5 pA; stage 54, 26.2%, 12.2 pA, 4.1 pA; stage 54, 14.3%, 30.3 pA, 17.1 pA; stage 55, 8.7%, 15.3 pA, 10.9 pA; stage 55, 26.2%, 15.3 pA, 10.4 pA. Continuous curves are Eq. 3 with k = 17.8 (Curve 1) and 25 (Curve 2). (Inset) Ratio of flash sensitivity with and without 11-cis-retinal treatment. 10 cells in total before stage 53 (4 at stage 50, 1 at stage 51, and 5 at stage 52) and 5 cells in total after stage 53 (3 at stage 54, 1 at stage 56, and 1 at stage 58). Sensitivity ratio before stage 53 being ∼8.5 and close to unity after stage 53. The reciprocal of 8.5 (horizontal dotted line) is used for estimating percentage of free opsin in prestage 53 rods, which gives 28% from Curve 1 and 22% from Curve 2. Image published in: Xiong WH and Yau KW (2002) Copyright © 2002, The Rockefeller University Press. Creative Commons Attribution-NonCommercial-ShareAlike license Larger Image Printer Friendly View |