XB-IMG-121239
Xenbase Image ID: 121239
|
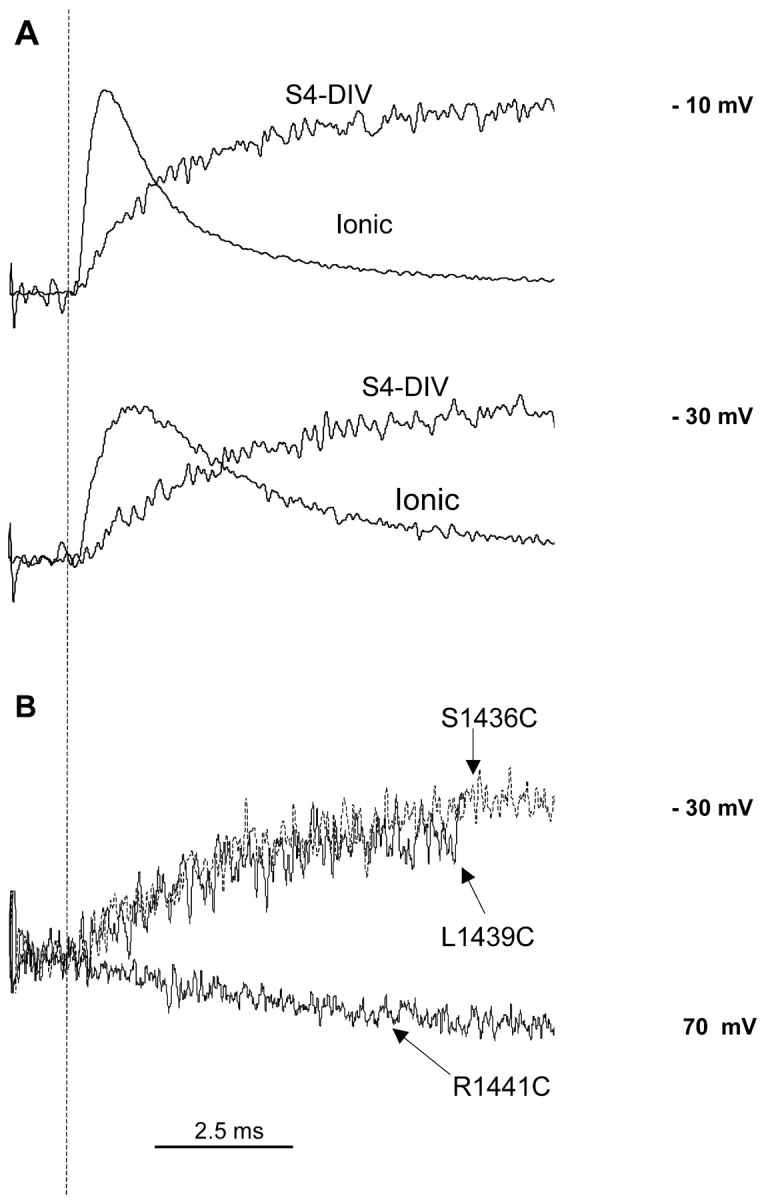
Figure 9. . Comparison of ionic currents and fluorescence signals from S1436C. (A) Ionic currents were obtained after subtracting the gating current component. Fluorescence and the ionic traces were scaled to have comparable peak amplitudes at every potential. The beginning of the pulse is marked with a dashed line. (B) Fluorescence traces recorded from three different sites (L1439C, S1436C, and R1441C) on S4 domain IV. The fluorescence data for S1436C and L1439C were recorded by pulsing to −30 mV and that for R1441C was recorded by pulsing to 70 mV. Image published in: Chanda B and Bezanilla F (2002) Copyright © 2002, The Rockefeller University Press. Creative Commons Attribution-NonCommercial-ShareAlike license Larger Image Printer Friendly View |