XB-IMG-126954
Xenbase Image ID: 126954
|
|
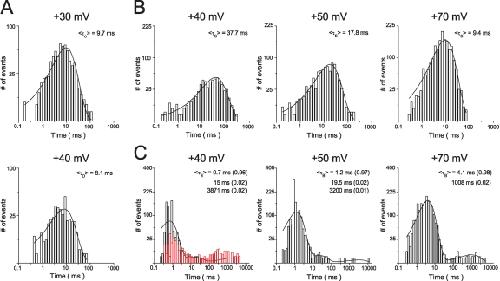
Figure 3. Voltage dependence of the kinetics of spermidine block. (A) Histograms for open times at +30 mV (top) and +40 mV (bottom). (B) Histograms for the substate times at the indicated voltage. (C) Histograms for the blocked times at the indicated voltage. Gray bars are data obtained in the presence of 0.1 µM [spermidine]i, and red bars are those in the control condition. Image published in: Liu TA et al. (2012) © 2012 Liu et al. Creative Commons Attribution-NonCommercial-ShareAlike license Larger Image Printer Friendly View |