XB-IMG-122537
Xenbase Image ID: 122537
|
|
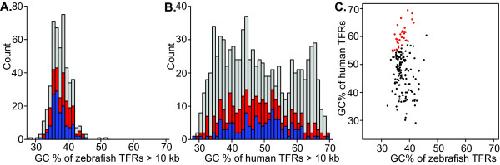
Figure 3. Comparison of the GC content of TFRs in zebrafish and human. (A) Histogram of the GC content of zebrafish TFRs. Area indicated in blue describes the subset of TFRs that have an orthologous TFR in human larger than 10 kb, the area in red have an orthologous TFR in human larger than 5 kb. (B) Histogram of the GC content of human TFRs. Area indicated in blue describes the subset of TFRs that have an orthologous TFR in zebrafish larger than 10 kb, the area in red have an orthologous TFR in zebrafish larger than 5 kb. (C) Scatter plot of the GC content of orthologous pairs of zebrafish and human TFRs ≥ 10 kb in both species. Points in red indicate TFR pairs with a difference of absolute GC% greater than 20. Image published in: Simons C et al. (2007) Copyright © 2007 Simons et al; licensee BioMed Central Ltd. Creative Commons Attribution license Larger Image Printer Friendly View |