XB-IMG-128549
Xenbase Image ID: 128549
|
|
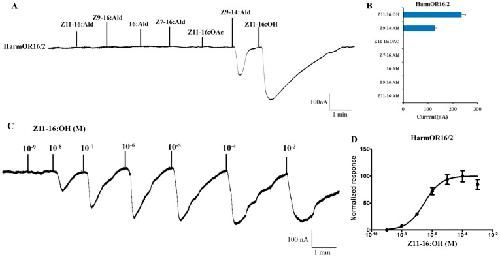
Figure 6. Responses of Xenopus oocytes with co-expressed HarmOR16/HarmOR2 to stimulation with pheromone compounds.(A) Inward current responses of HarmOR16/HarmOR2 Xenopus oocytes in response to 10−4 M solution of pheromone compounds. (B) Response profile of HarmOR16/HarmOR2 Xenopus oocytes. Error bars indicate SEM (n = 7). (C) HarmOR16/HarmOR2 Xenopus oocytes stimulated with a range of Z11-16:OH concentrations. (D) Dose–response curve of HarmOR16/HarmOR2 Xenopus oocytes to Z11-16:OH. Responses are normalized by defining the maximal response as 100. EC50 = 2.988×10⁻⁷ M. Error bars indicate SEM (n = 6). Larger Image Printer Friendly View |