XB-IMG-124950
Xenbase Image ID: 124950
|
|
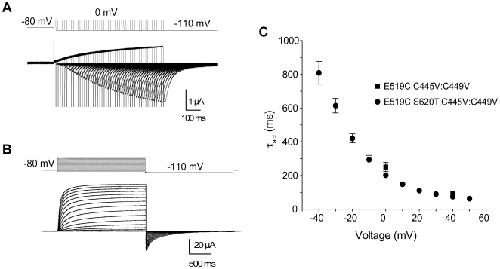
Figure 4. Time course of activation is slow in hERG channels.(A) Representative current traces recorded using an envelope of tails protocol, obtained from the E519C:C445V:C449V mutant. Membrane potential was stepped to 0 mV from −80 mV for varying durations of time and repolarized to −110 mV. The downward pulses are capacitive currents for each pulse. (B) Representative current traces from the E519C:S620T:C445V:C449V channels, using the same two-pulse protocol as in Fig. 2A. (C) Plot of time constants of activation against voltage. Squares represent τact from E519C:C445V:C449V for two voltages (0 and +40 mV), obtained by plotting the peak tails versus test pulse duration (n = 8 for each voltage), then fitting using a single exponential. Circles represent τact from E519C:S620T:C445V:C449V, obtained by fitting the current activation phase with a single exponential (n = 8). Image published in: Es-Salah-Lamoureux Z et al. (2010) Es-Salah-Lamoureux et al. Creative Commons Attribution license Larger Image Printer Friendly View |