XB-IMG-129258
Xenbase Image ID: 129258
|
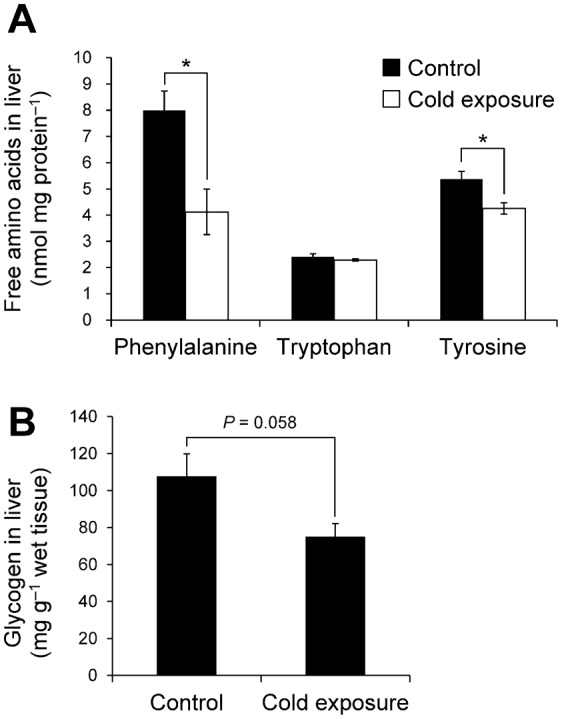
Fig. 7. Comparisons of free aromatic amino acid levels and glycogen levels in the liver between the control and cold-exposure conditions.(A) Free amino acids in the liver (n = 3). (B) Glycogen in the liver (n = 4). Each bar represents the s.e.m. *P<0.05 by Student's t-test. Image published in: Nagasawa K et al. (2013) © 2013. Creative Commons Attribution license Larger Image Printer Friendly View |